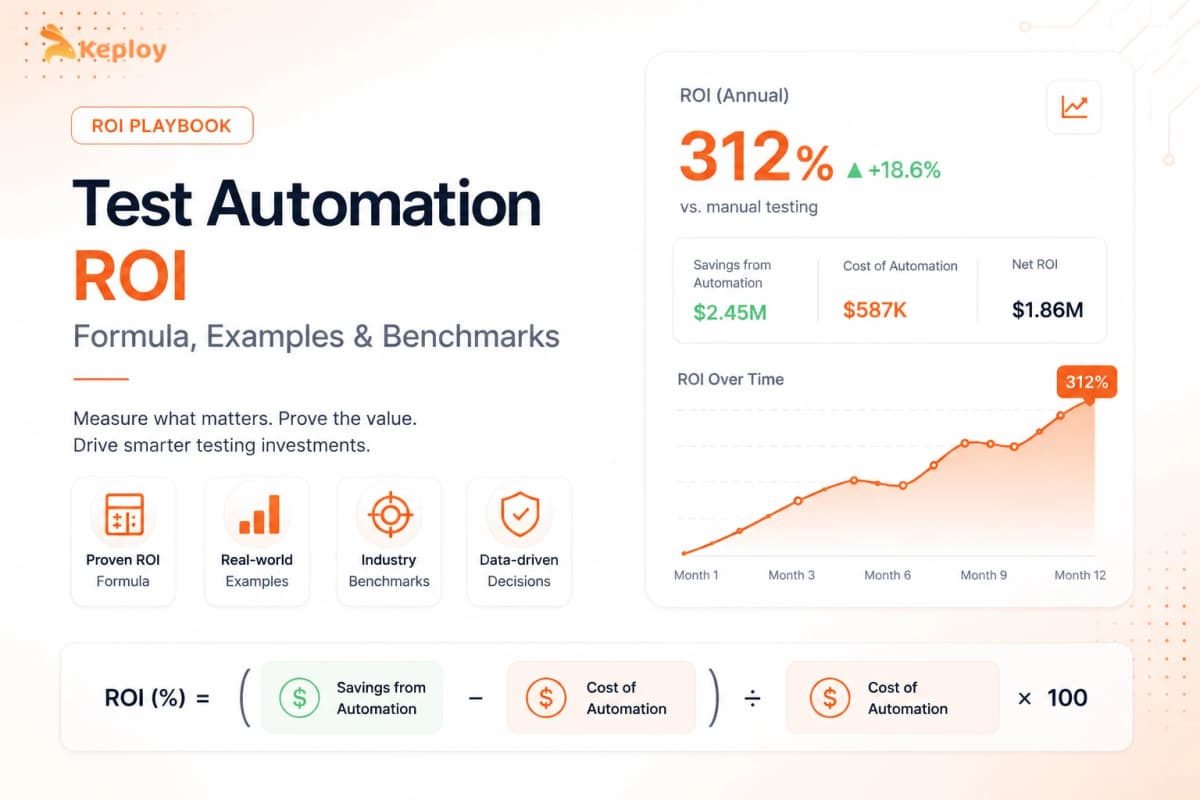






Test automation ROI measures the financial return of automating tests against the full cost of building and maintaining them. Most teams overstate savings and underestimate maintenance – the cost that compounds quietly year over year. The strongest returns come from keeping the investment side lean. Keploy addresses this directly by eliminating manual test authoring, which is where most of the upfront cost hides.
Your team automated hundreds of test cases. Leadership wants to know if it was worth it. Most engineering teams can’t give them a number. That’s what gets automation budgets cut. Proving test automation ROI means translating testing activity into financial terms: hours saved, defects prevented before they cost 5-10x more to fix in production, and release cycles shortened enough to matter on a balance sheet.
The formula exists. The benchmarks exist. The gap is knowing how to apply them to your specific team and stack.
What is test automation ROI?
Test automation ROI (Return on Investment) measures the financial and operational value gained from automating software tests compared to the total cost of building, running, and maintaining that automation. It answers the question: for every dollar invested in test automation, how much value does the organisation get back? A positive ROI confirms the investment is justified. A negative one (especially in the first few months) is normal and doesn’t mean automation is failing.
Test automation ROI in software testing measures the net return on your automation program relative to its total cost. It covers both hard savings (reduced manual testing hours, faster release cycles, fewer escaped defects) and the full investment (tool licensing, engineer time for authoring and maintenance, infrastructure). Understanding both sides of the equation is what separates a credible ROI measurement from a wishful estimate.
The reason ROI matters beyond coverage metrics is that coverage tells you what your tests touch. ROI tells you whether touching it is worth what you paid. A team with 85% code coverage but high maintenance costs and infrequent test runs may have negative ROI. A team with 60% coverage but high-frequency regression on a critical API path may have outstanding ROI. The metric is about value, not volume.
What Is the Test Automation ROI Formula?
The standard test automation ROI formula is:
ROI = (Savings from Automation − Cost of Automation) / Cost of Automation × 100
This produces a percentage. A result of 100% means the automation returned twice the investment. A result of 150% means every dollar invested returned $2.50.
Worked example:
A team invests $40,000 in test automation across tool licensing, setup, and the first year of engineer time. Over the same year, automation replaces manual testing effort that would have cost $100,000 to perform manually.
ROI = ($100,000 − $40,000) / $40,000 × 100 = 150%
That 150% means the investment paid for itself. It returned an additional 1.5x its cost in year one. In year two, if the automation investment drops to $15,000 in maintenance while savings hold at $100,000, the ROI climbs past 500%.
What counts as savings:
-
Manual testing hours replaced by automated runs
-
Faster release cycles and time-to-market gains
-
Defects caught pre-production rather than post-release
-
Reduced rework and debugging time
What counts as investment:
-
Tool licensing and infrastructure
-
Engineer time for test authoring and initial setup
-
Ongoing maintenance: industry average is 20-40% of initial investment annually
-
Training and onboarding
How Do You Calculate Test Automation ROI?
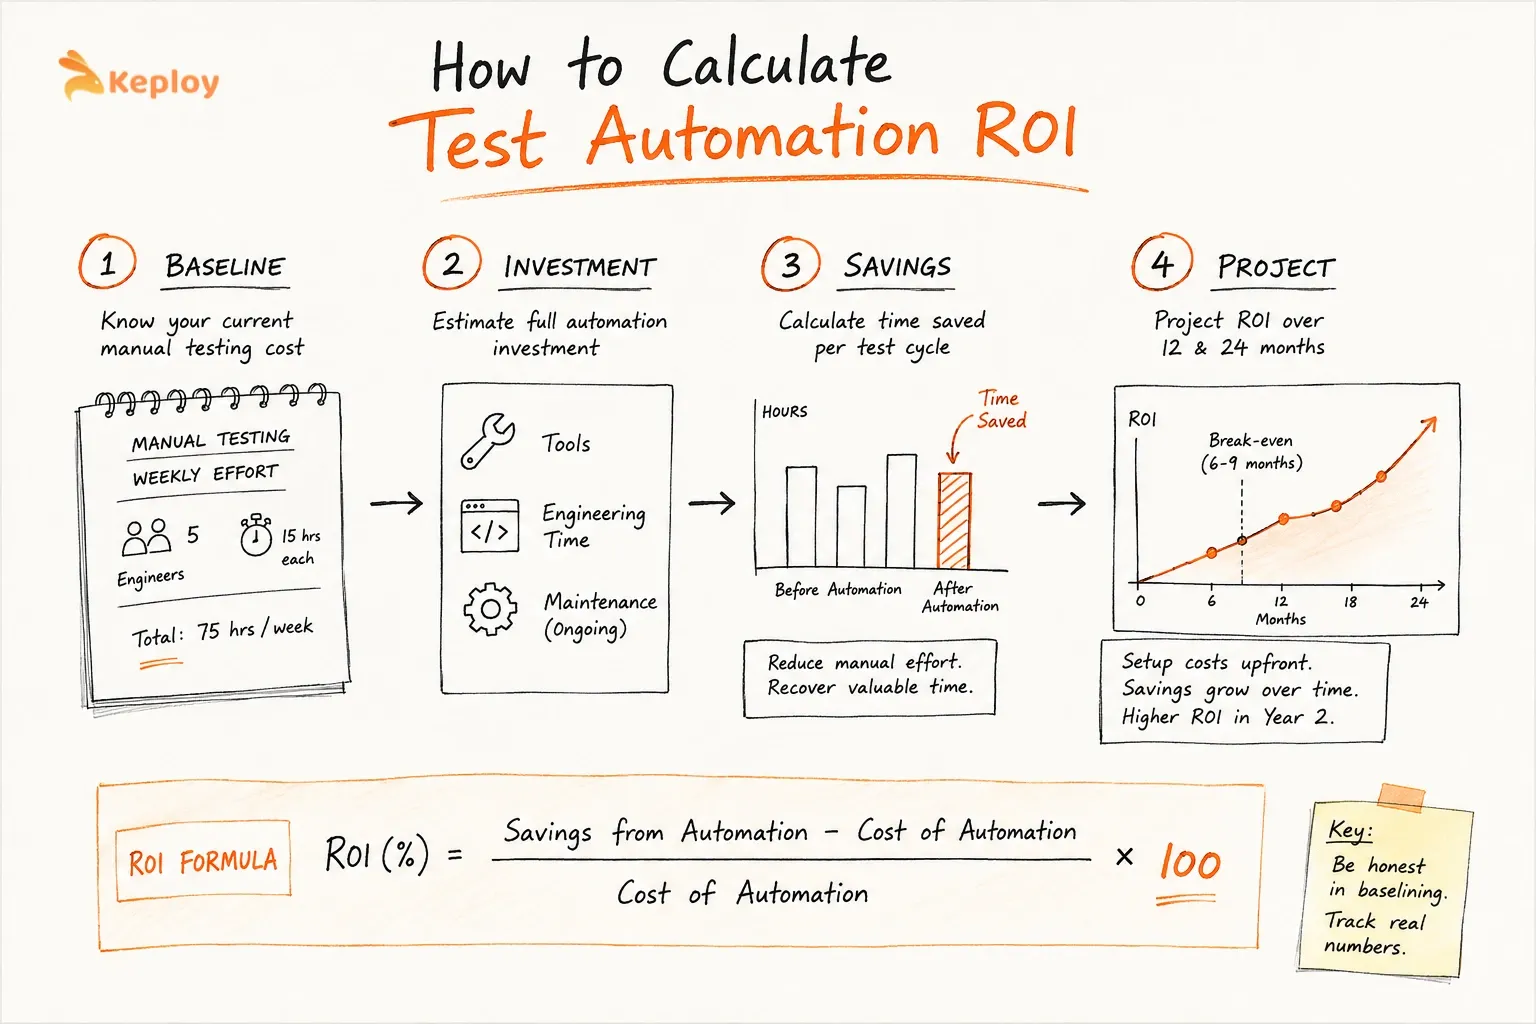
Calculating automation ROI requires four steps. The accuracy of your result depends on how honestly you baseline each one.
Step 1: Baseline your current manual testing cost.
Count the hours your team spends on manual regression per release cycle. Multiply by your loaded hourly cost (salary plus benefits plus overhead, typically $50-75/hour for mid-level QA engineers in the US). For a team of 5 engineers spending 15 hours each on regression weekly: 75 hours × $60 = $4,500/week = $234,000/year.
Step 2: Estimate your full automation investment.
Include everything: cost of test automation tools, engineer time to write tests, and annual maintenance. Don’t undercount. It’s the most common reason ROI projections collapse. Teams budget for setup but not for the 20-40% annual upkeep that every mature automation suite requires.
Step 3: Calculate savings per test cycle.
If automation’s replacing 80% of your weekly regression run: 75 hours × 80% = 60 hours saved per week × $60 = $3,600 saved per week. Annually: $187,200 in labour alone, before counting defect prevention and release speed gains.
Step 4: Project over 12 and 24 months.
Year 1 is always the most expensive. Setup costs are front-loaded and savings accumulate over time. Most enterprise teams reach break-even between months 6 and 9. By year 2, the same suite’s typically generating 3-5x its annual maintenance cost in savings.
Quick calculation table:
|
Scenario |
Annual savings |
Year 1 investment |
Year 1 ROI |
|
Conservative (50% manual replaced) |
$117,000 |
$55,000 |
113% |
|
Realistic (70% manual replaced) |
$163,800 |
$50,000 |
228% |
|
Optimistic (85% manual replaced) |
$199,000 |
$45,000 |
342% |
Assumes 5-person QA team, 75 hours/week manual regression, $60/hour loaded cost.
What Are the Key Test Automation ROI Metrics?
Test automation ROI measurement requires tracking metrics across three categories: cost, quality, and speed. Together they build the complete picture.
Cost metrics:
-
Manual testing hours replaced per sprint or release cycle
-
Engineer hours saved on test execution (not authoring)
-
Tool and infrastructure cost per test run
-
Maintenance cost as a percentage of initial investment
Quality metrics:
-
Defect detection rate: bugs caught in CI vs bugs found post-release
-
Escaped defect cost: each production bug costs 5-10x what it costs to fix in development
-
Change Failure Rate: the percentage of deployments that cause a production incident
-
Mean Time to Recovery: how fast the team recovers when something escapes
Speed metrics:
-
Release cycle time: days from feature-complete to production
-
Pipeline feedback time: minutes from commit to test result
-
Test execution time: total suite runtime per build
For teams already tracking DORA metrics, Change Failure Rate and MTTR are the two stability metrics most directly influenced by automation quality. Connecting your automation ROI story to DORA benchmarks gives leadership a framework they may already recognise.
Read our guide on DORA metrics to understand how each metric connects to specific engineering practices.
What Factors Affect Test Automation ROI?
Two sets of factors determine whether automation ROI is strong or disappointing.
Factors that increase ROI:
-
Test execution frequency is the single biggest driver. A test that runs once a month has low ROI regardless of how long it took to write. The same test running on every commit (potentially hundreds of times a month) has very high ROI because the authoring cost gets amortised across every run. High-frequency regression testing suites on stable APIs deliver the strongest returns.
-
Stable test targets matter too. Tests against stable APIs and business-critical flows need minimal maintenance. Tests against rapidly changing UI elements break constantly. They’re an overhead problem.
Factors that reduce ROI:
-
Automating the wrong tests is the most common mistake. It’s also the easiest to avoid. Teams often automate what’s technically easy rather than what’s high-frequency and high-value. Exploratory scenarios and one-off edge cases rarely justify the authoring cost.
-
High maintenance overhead is the second biggest ROI killer. Flaky tests that fail 20% of the time for no clear reason, or UI tests that break whenever a layout changes, consume engineer time faster than they save it. Maintenance running above 40% of the initial investment annually signals the automation strategy needs review.
Which Tests Have the Highest ROI to Automate?
Not every test type has equal ROI potential. Prioritising by ROI tier produces a focused strategy rather than a broad one that spreads effort across low-return scenarios.
|
Test type |
ROI tier |
Primary reason |
|
Regression tests on stable APIs |
Very high |
High frequency, low maintenance, direct defect prevention |
|
Smoke and sanity tests |
High |
Low authoring cost, runs on every commit, fast feedback |
|
Integration tests (service-to-service) |
High |
Catches contract failures before they reach production |
|
E2E UI tests on critical flows |
Medium |
High maintenance overhead offsets execution savings |
|
Performance and load tests |
Medium |
Periodic rather than continuous value |
|
Exploratory and ad hoc scenarios |
Low |
Human judgment required, scripting adds minimal value |
The practical rule: start with what your team runs most frequently. The ROI formula rewards frequency because the authoring cost divides across every run. A test suite running 200 times a year amortises its authoring cost 200 ways. One that runs 12 times a year amortises it 12 ways.
How Do You Reduce Automation Costs to Improve ROI?
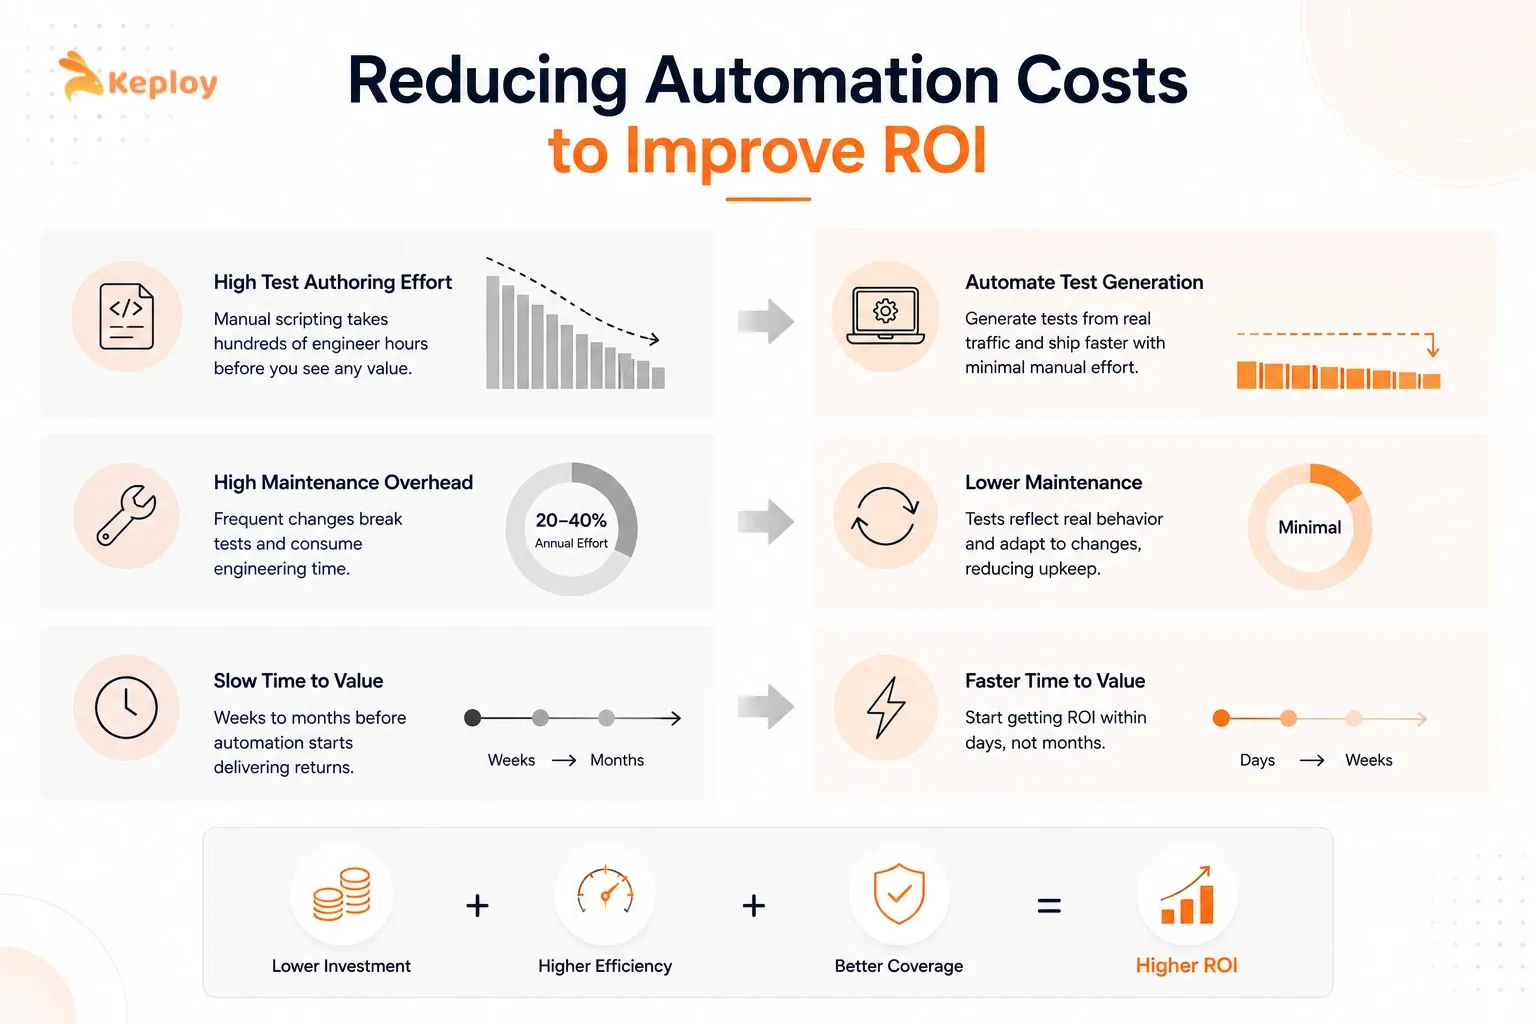
Most ROI improvement advice focuses on the savings side: automate more tests, run them more often, catch more defects earlier. That’s correct. But the faster path to higher ROI is reducing the investment denominator: specifically the authoring and maintenance costs that front-load year one and drag down the return.
-
Test authoring is the largest hidden cost. Writing test scripts manually is expensive. A team automating 500 regression tests at 2-3 hours per test is looking at 1,000-1,500 engineer hours before a single automated run happens. At $60/hour that’s $60,000-$90,000 in authoring cost alone, often underestimated in ROI projections because it’s distributed across sprints rather than appearing as a single line item.
-
Maintenance adds 20-40% annually. APIs change. UI layouts change. Service contracts drift. Every change that breaks an existing test consumes engineer time for zero new value. Teams that don’t budget for this upfront find their projections collapsing in year two when maintenance hours start competing with feature work.
-
Traffic-based test generation reduces both costs. Keploy captures real API traffic from production or staging environments and converts those request-response pairs into regression tests that run in CI. The authoring cost drops significantly. Tests aren’t written manually. They’re generated from actual user behaviour. Maintenance cost also reduces because tests derived from real traffic naturally reflect how the system is actually used rather than how engineers predicted it would be used.
For teams deploying AI coding tools that ship more code faster, this matters especially. More code means more tests needed. If test authoring doesn’t scale with code volume, the investment denominator grows and ROI declines even as throughput metrics improve. Automating test generation alongside code generation keeps the cost side of the equation from expanding unchecked.
How Does Keploy Improve Test Automation ROI?
Keploy improves test automation ROI by reducing the investment denominator in the ROI formula. It captures real API traffic from production and converts those interactions into CI regression tests automatically, with no manual test authoring required. Lower authoring cost means a smaller denominator, faster break-even, and a higher ROI percentage on the same savings.
The difference shows clearly in the numbers:
|
Approach |
Annual savings |
Year 1 investment |
ROI |
|
Traditional scripted automation |
$100,000 |
$80,000 |
25% |
|
Keploy (traffic capture) |
$100,000 |
$25,000 |
300% |
The $80,000 investment reflects tool cost plus 1,000+ hours of manual test authoring at $60/hour. The $25,000 reflects tool cost and CI integration only. Same savings. Dramatically different denominator.
Break-even shifts in proportion. Investing $80,000 and saving $8,000/month means break-even around month 10. Investing $25,000 at the same savings rate means break-even around month 3-4.
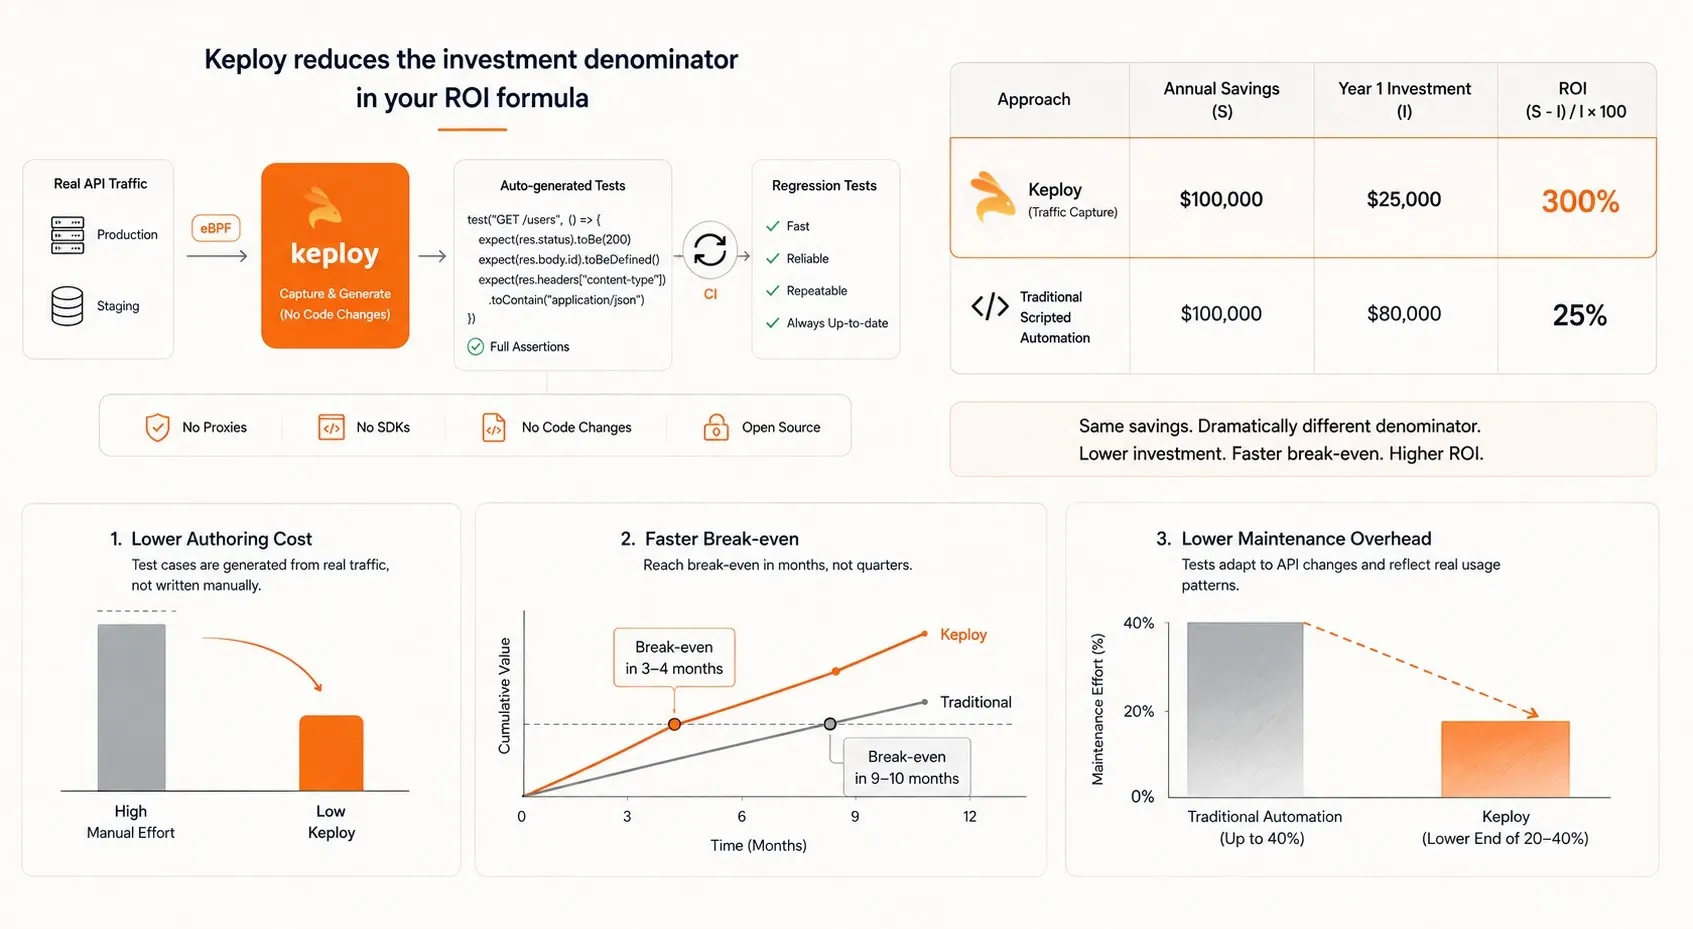
Maintenance overhead also improves. Tests derived from real traffic reflect actual usage patterns. When an API changes, captured tests update with it rather than requiring manual rewrites. Maintenance trends toward the lower end of the 20-40% annual benchmark rather than the upper end.
How Do You Build a Business Case for Test Automation?
The gap between engineering ROI analysis and finance-approved investment comes down to language. Engineering teams present test counts and coverage percentages. Finance teams approve hours saved, revenue protected, and headcount scale avoided.
-
Stop reporting activity metrics to leadership. "We automated 600 test cases" tells a CFO nothing. "Automation replaced 180 engineer-hours per week of manual regression, saving $562,000 annually at fully loaded cost" tells them everything.
-
Use a three-scenario projection. Present pessimistic, realistic, and optimistic cases. Leadership trusts a range more than a single number because a range acknowledges uncertainty. Pessimistic: 50% manual effort replaced, 9-month break-even. Realistic: 70% replaced, 6-month break-even. Optimistic: 85% replaced, 4-month break-even.
-
Show the multi-year view. Year 1 ROI is always the weakest because setup costs are front-loaded. A slide showing Year 1, Year 2, and Year 3 projections alongside the cumulative cost curve makes the investment logic obvious. The front-loading isn’t a problem. It’s expected and it’s the normal shape of automation investment.
-
Connect to revenue. Every defect that escapes to production has a cost: support tickets, customer churn, reputation damage, engineering time. Gartner estimates production defects cost 4-5x more than pre-production ones to resolve. If you’re shipping 20 escaped defects per quarter and automation cuts that to 5, the cost avoidance is real and quantifiable.
When Does Test Automation ROI Disappoint?
Honest assessment of the failure modes is more useful than another list of automation benefits.
-
Automating the wrong test cases. Teams often start with what’s technically convenient rather than what’s financially valuable. Automating a scenario that runs twice a year has near-zero ROI regardless of how well the test is written.
-
Underestimating maintenance. Year one looks good. Year two arrives and nobody budgeted for the engineer hours needed to update 300 UI tests after a frontend redesign. Maintenance running above 40% of initial investment annually is a warning sign.
-
Measuring too early. ROI at month two is almost always negative. That’s not failure. It’s the front-loading curve. Teams that evaluate at month two and cancel programs miss the savings that would have built from month six onward.
-
Tool-team mismatch. The wrong tool for the team’s skill level creates friction that consumes the savings it was supposed to generate. A team without Selenium expertise adopting a Selenium-heavy framework spends more time fighting the tool than building coverage.
-
Confusing activity with value. Test count, code coverage percentage, and suite runtime are activity metrics. They don’t measure ROI. Teams that report these to leadership set themselves up for budget cuts the moment anyone asks what those numbers mean in financial terms.
Conclusion
Test automation ROI comes down to one equation: are the savings from automated testing exceeding the cost of building and maintaining it? Getting that answer right requires honest baselining of manual testing costs, realistic budgeting for maintenance, and measuring over a long enough horizon to see the savings curve build.
The teams with the strongest ROI aren’t the ones with the most tests. They’re the ones who automated the right tests (high-frequency, high-stability, high-criticality) and kept authoring and maintenance costs low enough that the investment denominator never outgrew the savings. That’s the discipline that makes automation a financial asset rather than a technical overhead.
Frequently Asked Questions
What is a good ROI for automation testing?
A 150-200% ROI in year one is considered strong for most enterprise teams. Elite performers with high-frequency regression suites and stable test targets regularly exceed 300%. The standard break-even benchmark is 6-9 months for enterprise teams.
What are the main factors that impact test automation ROI?
Test execution frequency is the primary driver. It’s simple math. The more often tests run, the more the authoring cost gets amortised. Maintenance overhead, test target stability, and tool-team fit are the main factors that drag ROI down when not managed correctly.
How long does it take to see ROI from test automation?
Most enterprise teams reach break-even between 6 and 9 months. Teams with high-frequency regression on stable APIs can break even in 3-4 months. Teams with infrequent runs and high maintenance overhead may take 12-18 months.
What tools can help me track and present test automation ROI?
LinearB, Faros, and Haystack calculate DORA metrics that connect directly to ROI reporting. Jira and TestRail provide test execution data for manual vs automated tracking. Most teams build their initial ROI model in a spreadsheet before moving to dedicated dashboards.
Is test automation always worth the investment?
Not always. Tests that run infrequently, cover rapidly changing UI elements, or require constant manual updates often cost more to maintain than they save. ROI-focused automation starts with high-frequency, high-stability test cases and expands from there.
What is the difference between test automation ROI and test coverage?
Test coverage measures how much of the codebase your tests execute. ROI measures whether that execution is returning financial value. High coverage with low-frequency runs, poor test design, or high maintenance can still produce negative ROI.
Does using AI coding tools affect test automation ROI?
Yes. AI coding tools increase code output, which means more tests are needed to maintain quality. If test authoring doesn’t scale with code volume, the investment denominator grows and ROI declines. Automating test generation alongside code generation keeps the cost curve manageable.
What is the break-even point for test automation?
Break-even occurs when cumulative savings equal cumulative investment. For a team investing $50,000 in year one and saving $8,000/month through reduced manual testing, break-even arrives around month 7. Execution frequency is the key variable. The more often tests run, the faster savings accumulate.