






Why capturing HTTP Traffic is Crucial for Network Security?
Capturing HTTP traffic is like having a digital security camera at your network’s entrance, and it’s essential for keeping your network safe. This ‘camera’ helps you monitor who’s accessing your online space, allowing you to detect and prevent potential security threats, such as cyberattacks and unauthorized access before they can harm your system. This proactive approach is a fundamental practice to ensure the security and integrity of your network.
Behind the Scenes: The Work That Led to These Words
I was working on tracking my ingress HTTP traffic, and for that, I used the eBPF workshop repository from Datadog. It helped me keep a close eye on my network traffic easily and effectively, giving me useful insights for my project.
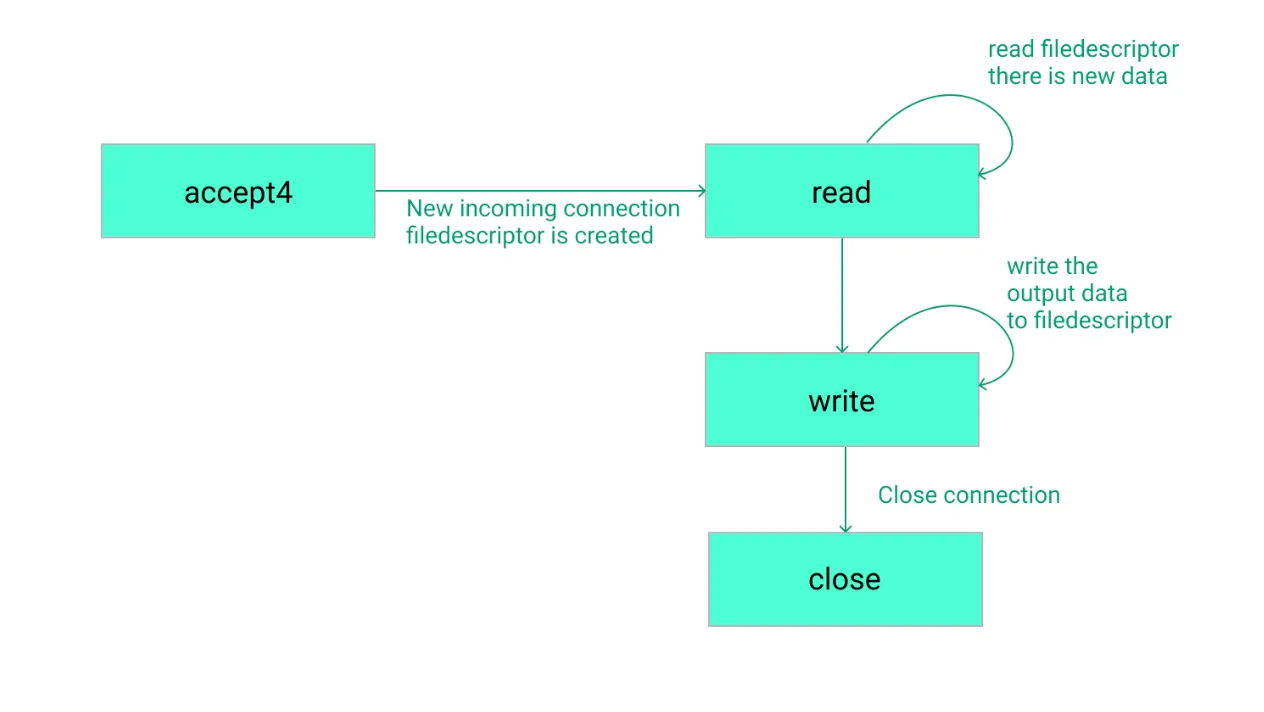
I discovered that monitoring ingress HTTP traffic is feasible by attaching it to system calls such as accept/accept4, read, write, and close. The same low-level tracing approach can also be extended to trace function arguments in Go applications when deeper application-level visibility is required.
-
Connection Establishment (accept/accept4): Here, a client creates a connection with the HTTP server, or inversely, the server acknowledges a client’s connection, yielding a new file descriptor in the process.
-
Reading/Writing (read/write): This involves the client or server performing multiple read and write operations to exchange HTTP requests and responses. Each pair of requests and responses is confined within the same connection on both ends.
-
Connection Termination (close): In this final step, both the client and the server mutually decide to terminate the established connection.
This structured process ensures the streamlined monitoring and management of HTTP traffic, providing crucial insights and enhancing network performance
Encountering Hurdles: The Challenge of Connection Pooling
Nonetheless, I stumbled upon an issue. When connection pooling was active, capturing traffic data for every individual request became unattainable. This situation presented a substantial barrier to my work. My objective was to meticulously document each request and response with every API interaction. This proved to be a considerable challenge in my experience with their ingress traffic controller.
The Close System Call Dilemma
I found that with connection pooling, the close system call isn’t executed for every request. In the existing codebase, the close system call’s function is to confirm the total bytes read and written on a specific connection file descriptor on the user side. Consequently, eBPF dispatches an event encapsulating these details.
Kernel Data Events: Reading and Writing
Each time a read or write system call is made, the kernel sends data events carrying the current bytes written or read. The total bytes read and written are accumulated for each individual read/write system call. This total is then checked against the total bytes read/write transmitted by the close event. After validation, the connection is released, and subsequent requests/responses employ different connection information.
Refer to this for the above snippet.
The Connection Pooling Hiccup
However, the hiccup with connection pooling is that the first request/response data is aggregated, but no close event is present to affirm it. As the second request utilizes the same connection and the data is once again summed up, this cycle continues until the server terminates the connection and then the close event is invoked. This method, thus, falls short in validating each request and response, resulting in logging inconsistencies.
Exploring a potential Solution
After searching through GitHub, I discovered a repository named grafana/beyla, which appeared to address connection pooling to a certain extent. Upon examining the Beyla codebase, I found that it doesn’t send the entire HTTP request/response buffer that includes both headers and body. Additionally, it doesn’t verify if the amount of data sent to the user space is accurate. However, for my particular needs, ensuring the completeness of the request and response data from the kernel space is essential.
Diving Into the Technical Details
Before we delve into the solution, let’s highlight the technical tools used. It’s notable that while Datadog opted for iovisor/bcc, my codebase made use of cilium/ebpf , which is closely related to libbpf. This choice was crucial for making sure the project was strong and adaptable to my needs.
Wondering about the differences between libbpf and bcc? Get more insight here to understand the careful consideration behind choosing cilium/ebpf.
Alright, Enough Talk! Let’s Solve It!

Okay, no more blah blah. Let’s jump into how I actually sorted this out. The trick I used was pretty straightforward. I grabbed all the requests and responses on the same connection and lined them up in a queue.
Now, here’s the simple part. I noticed that by just skipping over the first request, the first response data event could share the total bytes read for the current API request, as it’s already counted on the eBPF side after sending all the request data events. And the second request on the same connection could tell the total bytes sent of the previous response on that connection, thanks to it being already added up in the connection info struct.
With this easy method, I could check the total bytes read and written on that connection for each request. But here’s a tiny snag: for the last response, it’s a guessing game to know if it was the complete response or not. But for my needs, that was fine. I just assumed that a few seconds after the last activity, all my response events would have made it to the user space.
And guess what? This method is thread-safe too! I made sure to add a read-write mutex before operations in the functions to keep things running smoothly. This approach worked like a charm, whether connection pooling was on or off. And there you have it, problem solved!
Glimpses into my kernel and user space
Kernel Space:
Refer to this.
Refer to this for the above snippet.
The Vital Need to Capture Every Request and Response
In my current role as a core contributor at Keploy, the necessity to capture every request and response was paramount. Ensuring that no data was missed for every individual API request was crucial in enhancing Keploy’s support system.
Keploy stands as an open-source, user-friendly backend testing tool crafted with developers in mind. It not only simplifies backend testing for engineering teams but is also robust and easily extendable.
By recording API calls and database queries, Keploy efficiently generates test cases and data mocks/stubs from user traffic. This process markedly accelerates releases while boosting reliability, ensuring that your testing phase is both comprehensive and efficient.
Sample Test case generated using Keploy by capturing request and response metrics:
Conclusion
And there we have it, folks! From the initial hurdles with connection pooling and capturing every request and response to exploring solutions and implementing a thread-safe method that worked whether connection pooling was enabled or not, the journey has been both enlightening and productive. It is through these challenges and their subsequent solutions that tools like Keploy can continue to grow and serve the developer community more efficiently.
Remember, the journey doesn’t end here. Continuous improvement is the key to innovation. I’m open to any suggestions or improvements that could be made to enhance this process further. Your insights are not just welcomed; they are eagerly anticipated!
Feel free to check out the work and share your thoughts or suggestions on my GitHub Repository. Let’s keep the conversation going and work together to make technology even more robust and reliable.
For further reading and reference, you can visit the following links:
Thank you for joining me on this journey! Your collaboration and insights are invaluable in continuing to enhance and develop these technological solutions.