Kubernetes Proxy REST API
The Keploy Kubernetes Proxy runs as an in-cluster service that drives recording, replay, and observability for Deployments in one or more namespaces. Its REST API has two groups of routes:
- Operational routes such as
/record/start,/record/status,/test/start,/deployments, and/proxy/update. These are the routes used to control live in-cluster recording and replay. - API-server-compatible data routes under
/k8s-proxy/*. The Console and CLI use these paths for stored test cases, mocks, reports, schema, schema coverage, and saved configs. The proxy can serve these paths directly.
Use this API when you want to script the same Kubernetes live-recording flow the Keploy Console drives from CI/CD pipelines, operators, or internal tooling without running the keploy CLI on each node.
Base URL: https://<your-proxy-ingress> - the externally reachable address configured as ingressUrl when you installed the k8s-proxy Helm chart. In-cluster callers can use https://<release-fullname>.<release-namespace>.svc:8080 by default, or http://<release-fullname>.<release-namespace>.svc:8081 when proxy.insecure.enabled=true.
Recording modes: Sidecar and DaemonSet
The Kubernetes Proxy supports two recording modes. Both expose the same REST API documented here—pick whichever fits your environment.
- Sidecar mode (default). When recording starts, the proxy's
MutatingAdmissionWebhookinjects akeploy-agentsidecar container into the target Pod and rolls it. The agent intercepts traffic from the application container alongside it. This is the mode the rest of this document describes. - DaemonSet mode. A
keploy-daemonsetPod runs on each node and captures traffic from existing application Pods via eBPF—no sidecar injection, no application-Pod restart. Recording is scoped by aRecordingSessionCustom Resource that the proxy creates from/record/start; the DaemonSet agents pick it up and program their BPF target maps. This is the right mode when application Pods cannot be mutated (read-only RBAC on the application namespace), or when the rollout cost of injecting a sidecar is unacceptable. Cluster-mode auto-replay (a separate replay cluster reached via mounted kubeconfig) is supported in this mode.
The same /record/start, /record/stop, /test/start, /deployments, and report endpoints work identically across both modes—the difference is purely in how the agent is delivered to the workload.
Why the Kubernetes Proxy instead of Keploy Enterprise directly?
Running the Keploy enterprise CLI inside a Pod works, but it is a per-app, per-node model: each Deployment you want to record needs its own sidecar plumbing, image rebuild, or pod restart. The Kubernetes Proxy is a single in-cluster control plane that turns record-and-replay into a few API calls, and layers on top of that a set of capabilities you do not get when you run the agent on its own. The benefits below are the reason teams pick the proxy over wiring the CLI in by hand.
1. Auto-replay
The proxy auto-replays captured traffic against a fresh Pod and reports back which captures behave as deterministic tests. This happens continuously while you record (every autoReplayInterval minutes, default 5) and once more, against any trailing captures, the moment you call POST /record/stop. The whole loop collapses the "record now, find out tomorrow which tests are flaky" wait into the recording session itself.
This is also why replay belongs in the Kubernetes Proxy instead of a one-off CLI run: the proxy has the cluster, Deployment, release, and recording-session context needed to make replay release-aware. For a new-release flow, the proxy layer is designed to coordinate replaying the traffic captured for the new release together with the historical traffic the service has recorded before, so a release is checked against both the latest behavior and the behavior users already depended on. When the smart test set gets shipped, that historical input becomes the curated smart set: newly recorded traffic plus the latest duplicate-free version of the service's long-lived test coverage.
Each test case is exercised once against a freshly rolled Pod and classified into one of three buckets:
- Pass: kept as a real, stable test case.
- High-risk failure: marked as failed (a real regression to investigate).
- Low-risk failure with extractable noise: marked as noisy and kept in the test set but excluded from failure counts. These are typically captures whose only diff is a timestamp, request-ID, or generated UUID. If the proxy cannot extract the noisy fields, the capture is kept as a failed test case so it can be investigated.
While the proxy is at it, mocks the test case did not actually need are pruned. So even if the original Pod made 200 dependency calls per request, the final test case only carries the mocks it depended on, and your test sets stay tiny.
The cadence is configured via autoReplayInterval (see Auto-replay configuration below). When auto-replay runs as part of a re-record job, the proxy first asks the API server which suites passed last time. Replay still runs against the recorded test sets, but suite linking is gated so only suites that passed upstream and pass the fresh replay are linked forward.
2. Deduplication
A naive recorder turns a load test of GET /users/42 into 50,000 identical test cases. Keploy's deduplication keeps the canonical capture, counts the rest, and drops them, so a real test set comes out of even a noisy production traffic sample.
Enable per-recording with record_config.static_dedup, and optionally narrow the dedup key per endpoint with record_config.custom_dedup_fields, which declares which JSON paths in the request body, plus method/path/status, define "the same test." The agent enforces this at capture time before anything is written to storage, and per-pod dedup stats stream back into the recording status endpoint so you can watch duplicates being dropped live. See Static Deduplication for the full configuration reference.
3. REST API for in-cluster automation
Every action you perform from the Console or kubectl-keploy is also available as a REST call. The endpoint reference covers the full surface—/record/start, /record/stop, /test/start, /deployments, /proxy/update, the streaming status endpoints, the log and report endpoints, and the /k8s-proxy/* data routes the Console uses for stored test cases, mocks, schema, and reports.
4. Schema Generation and Management
Schema generation and per-release storage. Recording produces a free OpenAPI 3.0.3 schema as a side effect. The proxy infers it from the captured traffic, so the spec reflects the requests and responses Keploy actually observed during that recording. Schema records store namespace, deployment, app name, app release, cluster name, and tenant metadata; release-specific versions are selected by appRelease, which is typically your image tag or git SHA. That lets orders-api@v1.4.2 and orders-api@v1.4.3 be stored as separate release snapshots instead of overwriting each other. Coverage reporting layered on top tells you which endpoints have been exercised, and how deeply. Endpoints are documented under Reports and schema coverage.
Schema-conflict detection during auto-replay. During auto-replay, the proxy fetches the latest stored schema, generates a schema from the recorded test cases, and merges the two. If replay produces failed test-case details, the report records a schema conflict and stores the new schema accordingly. Compatible same-release additions update the existing schema; new releases or replay-detected conflicts insert a new schema document.
5. Smart test set (Upcoming)
The direct user benefit is simple: this layer is meant to maintain a smart, replay-ready test set for the service instead of leaving you to manage scattered recording sessions by hand. The goal is to keep the latest useful, duplicate-free version of the behavior your service has recorded over time. When you add an API endpoint, the new behavior can be folded in; when you delete an endpoint, stale coverage can be removed; when you change a request or response shape, the latest captured version can replace the old one. Future release replays can then run the newly recorded traffic plus this smart test set instead of every duplicate capture ever seen, which keeps replay fast, efficient, and easier to trust as a CI gate.
Current auto-replay already performs the in-session curation work:
- Cross-pod uniqueness within a session. When a Deployment with
replicas=5records into the same session, each pod's localtest-Ncounter does not collide with any other pod's. The proxy keeps them distinct so you don't end up with five different captures all namedtest-1. - Noise vs. failure separation. During auto-replay, captures with extractable timestamp/UUID-style diffs are tagged as noisy and kept in the test set (excluded from failure counts), while real regressions and low-risk captures without extractable noise are tagged as failures. The noise tag itself is useful information because it tells later replays which fields to ignore for that endpoint.
- Fresh-capture curation. Current auto-replay curates the test sets produced by the active recording session. Historical test set consolidation support exists in the codebase, but it is not active in the current record/start path.
Combined with capture-time static deduplication (benefit 2), this keeps the current replay set small, stable, and CI-gateable even when the underlying traffic is noisy.
Authentication
Authenticating to the proxy is a two-step exchange:
- Create a Personal Access Token (PAT) in the Keploy Console.
POST /get-shared-tokenwith that PAT to receive the cluster's shared token.
Every other protected route on the proxy is then gated on the shared token sent as a Bearer header:
Authorization: Bearer <K8S_PROXY_SHARED_TOKEN>
Only GET /healthz, the admission webhook POST /mutate, the bootstrap POST /get-shared-token, and the introspection GET /shared-token/info are unauthenticated. Every other route rejects missing or malformed headers with 401 Unauthorized.
# Verify the proxy is up (no auth required)
curl -sf https://$PROXY/healthz
# {"status":"ok"}
Why a two-step exchange?
The PAT identifies a specific user; the shared token authorizes calls against a specific cluster. Splitting the two lets callers (CI scripts, AI agents, internal tooling) store one user-rotatable PAT and exchange it at run time without kubectl access to the proxy namespace or an interactive user login. The shared token is still a cluster-wide secret and can also be surfaced through existing heartbeat-backed Console/API flows, so handle it as sensitive wherever it appears.
1. Issue a PAT
In the Keploy Console, open Settings → API Keys and click Create token. PATs are 47-character strings prefixed with kep_.
- The PAT must belong to the same tenant (
cid) as the cluster the proxy is registered to and includewriteoradminscope. The proxy will reject cross-tenant PATs or PATs with insufficient scope with403 Forbidden. - Treat the PAT like a password—it is the long-lived credential. Store it in your CI provider's secret store, not in the repo.
- A user can have multiple PATs. Revoke or rotate them from the same Console screen; revoked PATs stop working immediately.
2. Exchange the PAT for the shared token
There are two ways to do the exchange. Pick whichever fits your workflow—they both hit the same POST /get-shared-token endpoint.
Option A: From the Keploy Console
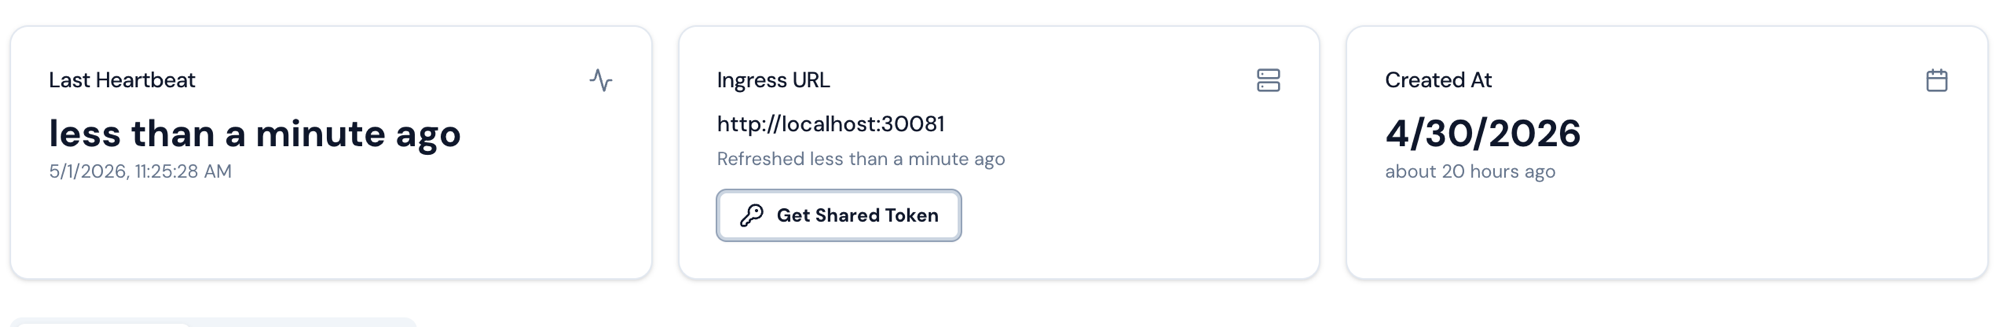
Open the cluster's detail page in the Console. Each cluster card on the top row shows the live ingress URL; the Get Shared Token button sits inside that card.
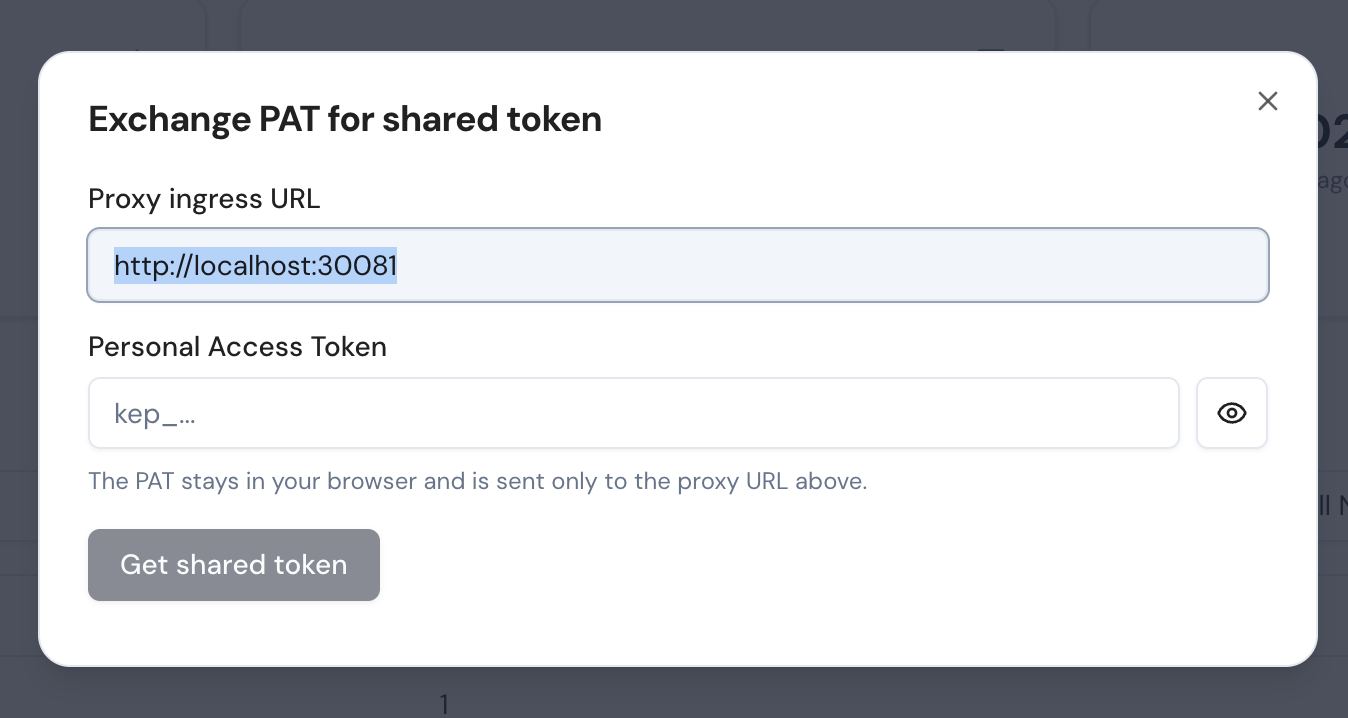
Clicking it opens a dialog pre-filled with the cluster's ingress URL. Paste your PAT and submit.
On success, the dialog displays the sharedToken, ingressUrl, and deploymentType returned by the proxy. Use the Copy sharedToken button to grab the token for your CI script or terminal.
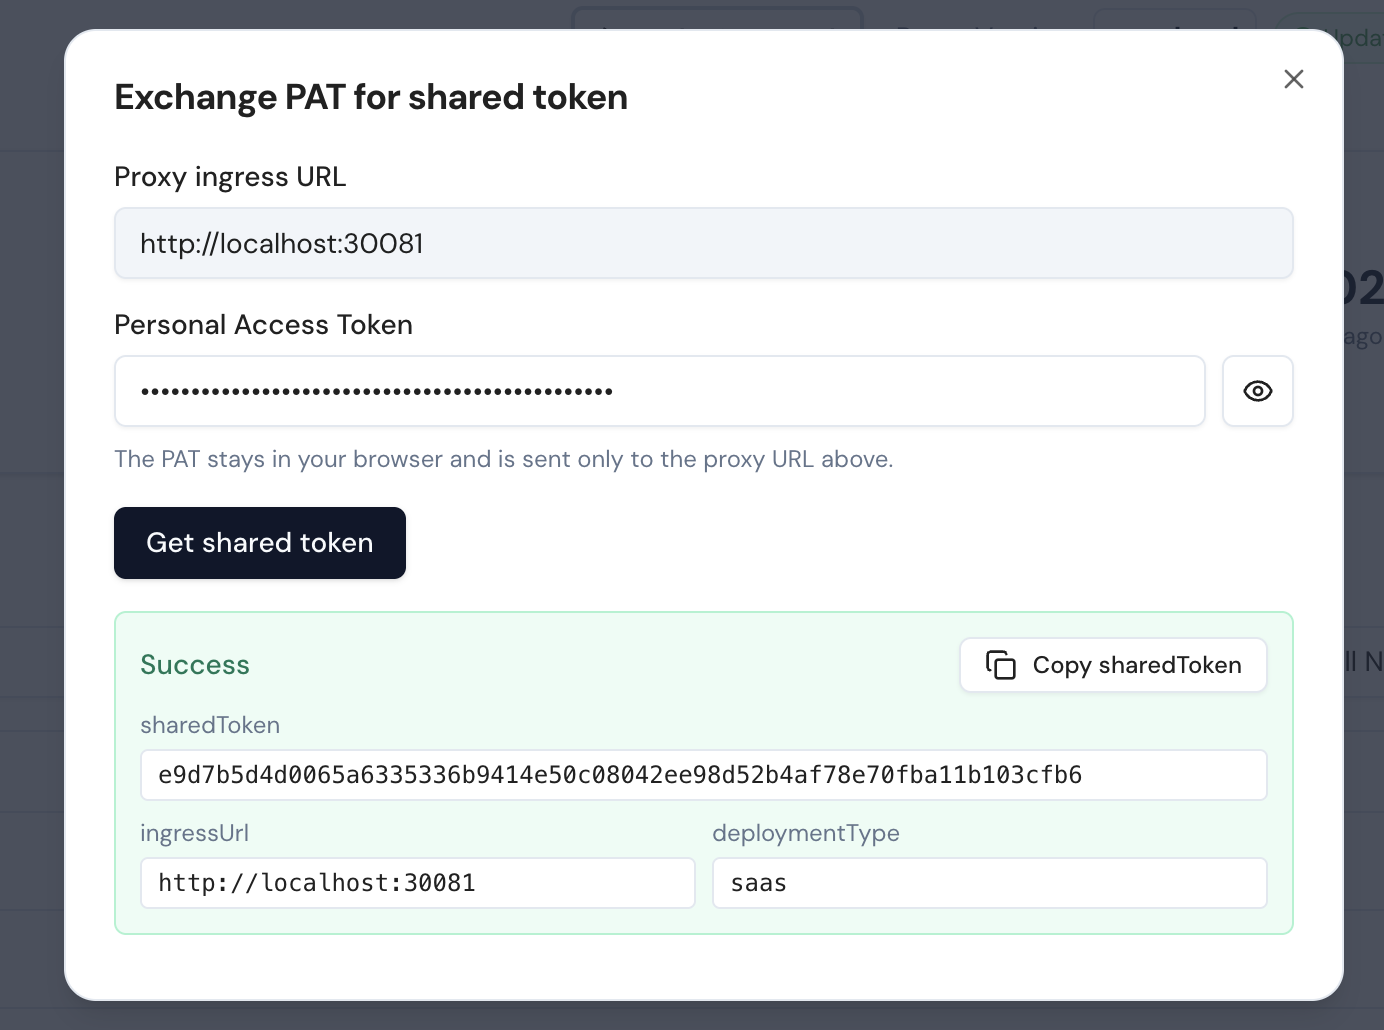
The PAT is held in browser memory for the lifetime of the dialog only—it's never persisted to local storage and never sent to the Keploy API server from the Console (the proxy itself does that validation server-side).
Option B: From a shell
PROXY="https://your-proxy-ingress"
PAT="kep_xxxxxxxxxxxxxxxxxxxxxxxxxxxxxxxxxxxxxxxxxxx"

RESP=$(curl -sS -X POST "$PROXY/get-shared-token" \
  -H "Authorization: Bearer $PAT")

K8S_PROXY_SHARED_TOKEN=$(echo "$RESP" | jq -r '.sharedToken')
INGRESS_URL=$(echo "$RESP" | jq -r '.ingressUrl')

AUTH="Authorization: Bearer $K8S_PROXY_SHARED_TOKEN"
A successful exchange returns:
{
  "ingressUrl": "https://your-proxy-ingress",
  "sharedToken": "3e14be232bce3e3cf6f6d58f284b6eb88db3280c54d93a7951e5000c6bbe3e9a",
  "deploymentType": "saas",
  "tokenId": "408aaecaba458939",
  "issuedAt": 1777883713
}
sharedToken—use this on every subsequent call asAuthorization: Bearer <sharedToken>.ingressUrl—echoes back the address the proxy was installed with, so a script can derive every other URL from one bootstrap call.deploymentType—either"saas"for the hosted control plane or"self-hosted"for self-hosted installs.tokenId—a short non-secret identifier that changes whenever the proxy regeneratessharedToken. Cache it alongside the token; useGET /shared-token/infoto check whether your cached value is still current.issuedAt—unix timestamp when the proxy minted thissharedToken.
Shared token lifetime and rotation
The shared token is generated fresh in process memory at every Pod startup with crypto/rand (32 bytes, hex-encoded). It is not stored in a Kubernetes Secret, not persisted to disk, and not stable across restarts. Concretely, the token rotates whenever:
- the proxy Pod restarts (CrashLoop, eviction, node drain, OOM),
helm upgraderolls the proxy Deployment,- you call
POST /proxy/updateand the new image becomes ready.
Treat the shared token as scoped to one running process, not "the lifetime of the install." A CI script that exchanges the PAT once and caches the result for hours will start getting 401 Invalid token the moment the proxy is rolled.
Detecting a rotated token
GET /shared-token/info returns only the current tokenId and issuedAt—never the token itself, so it is safe to call without the shared token.
curl -sS "$PROXY/shared-token/info"
# {"tokenId":"408aaecaba458939","issuedAt":1777883713}
Recommended pattern in CI: cache (tokenId, sharedToken) together when you exchange, and before every long-running operation (or as a quick guard at the start of every step) hit /shared-token/info to compare. If tokenId differs from your cached value, re-exchange the PAT.
CACHED_TOKEN_ID="$(jq -r '.tokenId' < ~/.cache/keploy-proxy.json)"
CURRENT_TOKEN_ID="$(curl -sS "$PROXY/shared-token/info" | jq -r '.tokenId')"
if [ "$CACHED_TOKEN_ID" != "$CURRENT_TOKEN_ID" ]; then
  # proxy was restarted, re-exchange the PAT
  RESP=$(curl -sS -X POST "$PROXY/get-shared-token" -H "Authorization: Bearer $PAT")
  echo "$RESP" > ~/.cache/keploy-proxy.json
fi
If you instead see a sudden 401 Invalid token on a previously working sharedToken, that's the same signal: the proxy was rolled. Re-exchange the PAT and retry once.
Exchange failure modes
| Status | When |
|---|---|
401 | Missing/empty Authorization header, or the PAT is invalid, revoked, or expired. |
403 | The PAT is valid but belongs to a different tenant than this proxy's cluster, or it does not include write/admin scope. |
502 | The proxy could not reach the API server to validate the PAT (transient—retry). |
503 | The proxy is still booting and has not authenticated to the API server yet (retry). |
Under the hood, POST /get-shared-token calls POST /cluster/pat/validate on the API server (using the proxy's own cluster JWT) to verify the PAT, then returns the cached shared token only on success. The PAT is never echoed back, never stored on the proxy, and never logged in cleartext.
The shared token is cluster-wide, not per-user. The PAT-exchange path authenticates who is allowed to bootstrap it, but the returned shared token should still be treated as a sensitive cluster credential.
Quick start: Trigger and watch a live recording
The golden path: authenticate, pick a Deployment, start a recording, stream its status, and stop it when you have the traffic you need.
1. Set up variables and authenticate
PROXY="https://k8s-proxy.example.com"    # ingressUrl from Helm install
PAT="kep_xxxxxxxxxxxxxxxxxxxxxxxxxxxxxxxxxxxxxxxxxxx"
NS="default"
DEPLOY="orders-api"

# One-time PAT → shared-token exchange (see Authentication above)
K8S_PROXY_SHARED_TOKEN=$(curl -sS -X POST "$PROXY/get-shared-token" \
  -H "Authorization: Bearer $PAT" | jq -r '.sharedToken')

AUTH="Authorization: Bearer $K8S_PROXY_SHARED_TOKEN"
2. Discover target Deployments
curl -s -H "$AUTH" "$PROXY/deployments?namespace=$NS" | jq
# [{"name":"orders-api","namespace":"default","replicas":3,"readyReplicas":3}]
3. Start a recording
RECORD_ID=$(curl -s -X POST "$PROXY/record/start" \
  -H "$AUTH" -H "Content-Type: application/json" \
  -d '{
    "namespace": "'"$NS"'",
    "deployment": "'"$DEPLOY"'",
    "podsCount": 3,
    "clusterId": "prod-use1",
    "record_config": {
      "static_dedup": true,
      "enable_sampling": 10,
      "filters": [
        { "path": "/health", "urlMethods": ["GET"] }
      ]
    }
  }' | jq -r '.id')

echo "Recording started: $RECORD_ID"
On success the proxy registers the session before it touches the workload, ensures the mutating webhook configuration is present, copies the CA secret into the target namespace, creates the headless Service, and triggers a targeted restart of the selected pods so the agent is injected as they come back.
4. Stream session status
curl -N -H "$AUTH" "$PROXY/record/status?record_id=$RECORD_ID"
This returns newline-delimited JSON—one event per state change. Each line includes the current testcase count, endpoints seen, mock counts, and static_dedup_stats when static dedup is enabled.
{
  "test_cases_count": 12,
  "endpoints": [
    {
      "name": "test-1",
      "endpoint": "/orders",
      "method": "GET",
      "status_code": 200
    }
  ],
  "mock_count": 8,
  "mock_types": {"SQL": 3},
  "status": "running",
  "pods_running": 3,
  "static_dedup_stats": [],
  "started_at": 1712345678
}
5. Stop the session
curl -s -X POST "$PROXY/record/stop" \
  -H "$AUTH" -H "Content-Type: application/json" \
  -d '{"record_id":"'"$RECORD_ID"'"}'
# {"record":"stopped","id":"default-orders-api"}
The proxy tears down the headless Service, unloads the agent on the next rollout, and flushes the recorded tests to the platform store so they show up under that app in the Keploy Console.
Recording configuration
The record_config block in POST /record/start is a UI-friendly subset of the OSS config.Record struct and is persisted alongside the session so the UI can prefill it and so the exact inputs are auditable.
| Field | Type | Description |
|---|---|---|
filters | Filter[] | Traffic patterns to filter during recording. Matches use AND semantics across fields. |
client_key | string | Optional client identifier propagated to downstream mock capture (useful for multi-tenant apps). |
enable_sampling | uint | If set to a positive value, sample 1-in-N matching requests. Omit or set 0 to use the proxy default. |
static_dedup | bool | Drop schema-identical traffic in the agent before it becomes a test case. See Static Deduplication. |
custom_dedup_fields | EndpointDedupFields[] | Add value-aware fingerprints for matching endpoints. Providing this also enables static dedup for the injected sidecar. |
low_latency_mode | bool | Start the agent in low-latency mode. |
debug | bool | Start the injected agent with debug logs. |
memory_limit | string | Memory request in MiB, expressed as a positive integer string. The container limit is set to twice this value. |
secret_protection | object | Enable record-time secret detection/obfuscation with optional custom headers, body keys, URL params, and allow lists. |
Each Filter accepts:
| Field | Type | Description |
|---|---|---|
path | string | Regex matched against the request path. |
host | string | Hostname to match. |
port | uint | Port to match. |
urlMethods | string[] | HTTP methods (e.g. ["GET","POST"]). |
headers | map[string]string | Header key/value pairs to match. |
filterPolicy | string | exclude (default) or include. |
Auto-replay configuration
Attach an auto_replay_config to POST /record/start to automatically replay freshly recorded test sets against a standalone Pod the proxy provisions. Each replay runs in isolation against a fresh Pod + Service so it cannot disturb production traffic.
| Field | Type | Description |
|---|---|---|
autoReplayInterval | int64 (minutes, default 5) | Cooldown between replays for the same session. |
mongoPassword | string | Override for user-provided Mongo credentials used during replay. |
apiTimeout | uint64 (seconds) | Per-request timeout for the replayed application. |
delay | uint64 (seconds) | Initial delay before starting tests (lets the standalone Pod warm). |
globalNoise | object | Fields to ignore during diffing. Accepts global and test-sets. |
envOverrides | map[string]string | Env var overrides for the standalone replay Pod. |
Endpoint reference
All paths are relative to the proxy base URL. Unless noted, every route requires Authorization: Bearer <K8S_PROXY_SHARED_TOKEN>.
Health and admission
| Method | Path | Auth | Description |
|---|---|---|---|
GET | /healthz | No | Liveness probe. Returns {"status":"ok"}. |
POST | /mutate | No | Kubernetes MutatingAdmissionWebhook endpoint. Do not call directly. |
Bootstrap
| Method | Path | Auth | Description |
|---|---|---|---|
POST | /get-shared-token | Authorization: Bearer <PAT> | Exchange a Personal Access Token for the proxy's shared token. See Exchange the PAT for the shared token for details. |
GET | /shared-token/info | None | Return only the current tokenId and issuedAt; never the token itself. Use this to detect when the proxy has rotated the shared token (Pod restart, helm upgrade, self-update). |
POST /get-shared-token gates on a PAT instead of the shared token because the caller does not yet have one. GET /shared-token/info is unauthenticated because the response leaks no credential material. Every other route below requires Authorization: Bearer <K8S_PROXY_SHARED_TOKEN>.
Deployments
| Method | Path | Description |
|---|---|---|
GET | /deployments?namespace=<ns> | List Deployments. Omit namespace for cluster-wide (unless scoped). |
Recording
| Method | Path | Description |
|---|---|---|
POST | /record/start | Start a recording session. Body: RecordRequest. See quickstart above. |
POST | /record/stop | Stop a session. Body: {"record_id":"..."}. |
GET | /record/status?record_id=<id> | Stream session status (NDJSON). One line per state change. |
GET | /record/active?namespace=<ns>&deployment=<dep> | Check whether a session is running for a Deployment. Returns in_progress + record_id. |
GET | /record/app-status?namespace=<ns>&deployment=<dep> | Report agent-injection and Pod-readiness status for the target app. |
GET | /record/logs?namespace=<ns>&deployment=<dep>&... | Tail recording-session logs. Accepts stream, previous, tail_bytes, stream_bytes. |
GET | /record/logs/check?namespace=<ns>&deployment=<dep> | Cheap check: are session logs available? |
GET | /record/logs/download?namespace=<ns>&deployment=<dep> | Download recording logs as a ZIP. |
RecordRequest body:
{
  "namespace": "default",
  "deployment": "orders-api",
  "podsCount": 3,
  "clusterId": "prod-use1",
  "record_config": {"static_dedup": true, "enable_sampling": 10, "filters": []},
  "auto_replay_config": {"autoReplayInterval": 10, "delay": 5}
}
Replay / Test
| Method | Path | Description |
|---|---|---|
POST | /test/start | Start a replay. Body: ReplayRequest with optional test_config. |
POST | /test/stop | Stop a replay. Body: {"replay_id":"..."}. |
GET | /test/status?replay_id=<id> | Stream replay status and per-testcase results (NDJSON). |
GET | /test/active?namespace=<ns>&deployment=<dep> | Check whether a replay is in progress for this Deployment. |
POST | /test/mock-metadata | Extended mock metadata. |
POST | /test/normalize | AI-normalize testcases in a run. |
GET | /test/download?... | Download a full test bundle (ZIP). |
GET | /test/download/active?... | Download tests from the currently active recording session. |
GET | /test/logs?namespace=<ns>&deployment=<dep>&... | Tail replay logs. Same flags as /record/logs. |
GET | /test/logs/check?namespace=<ns>&deployment=<dep> | Replay-logs availability check. |
GET | /test/logs/download?namespace=<ns>&deployment=<dep> | Replay logs ZIP. |
ReplayRequest body:
{
  "namespace": "default",
  "deployment": "orders-api",
  "test_config": {
    "selectedTests": {"test-set-0": ["tc-1", "tc-2"]},
    "apiTimeout": 30,
    "delay": 5,
    "globalNoise": {"global": {"header": {"Date": []}}},
    "envOverrides": {"FEATURE_FLAG_X": "off"}
  }
}
Omit selectedTests to replay every set.
API-server-compatible data routes
These routes are all mounted under /k8s-proxy and are served directly by the proxy. Direct proxy calls use the proxy shared token; calls routed through the API server use normal Console/API-server authentication and role checks.
Health
| Method | Path | Description |
|---|---|---|
GET | /k8s-proxy/health | Health check for the API-server-compatible data surface. |
Test cases, mocks, and mappings
| Method | Path | Description |
|---|---|---|
POST | /k8s-proxy/testcases | Insert a testcase. |
POST | /k8s-proxy/testcases/bulk | Insert multiple testcases. |
GET | /k8s-proxy/testcases | Fetch testcases. |
GET | /k8s-proxy/testcases/detail | Fetch one testcase payload. |
GET | /k8s-proxy/testcases/metadata | Fetch testcase metadata. |
POST | /k8s-proxy/testcases/selective | Fetch selected testcases. |
PUT | /k8s-proxy/testcases/{testCaseId} | Update one testcase. |
PUT | /k8s-proxy/testcases/bulk | Update multiple testcases. |
DELETE | /k8s-proxy/testcases | Delete testcases. |
GET | /k8s-proxy/testcases/testsets | List test set IDs. |
GET | /k8s-proxy/testcases/testsets/metadata | List test set metadata. |
GET | /k8s-proxy/testcases/testsets/latest-release/full | Fetch latest-release test sets with full data. |
DELETE | /k8s-proxy/testcases/testset | Delete a test set. |
POST | /k8s-proxy/mocks/upload | Upload mocks. |
GET | /k8s-proxy/mocks/download | Download mocks. |
GET | /k8s-proxy/mocks/reference | Fetch mock reference metadata. |
POST | /k8s-proxy/mocks/reference | Insert or update mock reference metadata. |
DELETE | /k8s-proxy/mocks/reference | Delete mock reference metadata. |
POST | /k8s-proxy/mappings | Upload mappings. |
GET | /k8s-proxy/mappings | Fetch mappings. |
Reports and schema coverage
| Method | Path | Description |
|---|---|---|
POST | /k8s-proxy/insert/testCaseResult | Insert testcase result data. |
GET | /k8s-proxy/get/testCaseResults | Fetch testcase result data. |
DELETE | /k8s-proxy/clear/testCaseResults | Clear testcase result data. |
POST | /k8s-proxy/insert/report | Insert a test report. |
GET | /k8s-proxy/get/report | Fetch one test report. |
GET | /k8s-proxy/get/allReports | List stored reports. |
GET | /k8s-proxy/get/testRunIds | List test run IDs. |
GET | /k8s-proxy/get/testRunReports | Fetch test-run-level reports. |
GET | /k8s-proxy/get/testSetReports | Fetch test-set-level reports. |
GET | /k8s-proxy/get/testCaseReports | Fetch per-testcase reports. |
PUT | /k8s-proxy/update/report | Update a report. |
POST | /k8s-proxy/report/multipart | Upload a multipart test-run report. |
POST | /k8s-proxy/autoreplay-metrics | Insert auto-replay metrics. |
GET | /k8s-proxy/autoreplay-metrics | Fetch auto-replay metrics. |
POST | /k8s-proxy/insert/schema | Insert captured OpenAPI schema. |
PUT | /k8s-proxy/update/schema | Update captured OpenAPI schema. |
GET | /k8s-proxy/get/schema | Fetch captured OpenAPI schema. |
GET | /k8s-proxy/get/schema-coverage | Fetch per-endpoint schema coverage. |
POST | /k8s-proxy/schema-coverage-report | Save a schema coverage report. |
GET | /k8s-proxy/get/schema-coverage-summary | Fetch schema coverage summary. |
GET | /k8s-proxy/get/top-schema-coverage-summary | Fetch top-N schema coverage summary. |
Saved config
| Method | Path | Description |
|---|---|---|
POST | /k8s-proxy/config | Insert or update saved proxy config. |
GET | /k8s-proxy/config/{namespace}/{deployment}/{kind} | Fetch saved config. kind can be record, replay, or autoreplay. |
GET | /k8s-proxy/config/list/{kind} | List saved configs by kind. |
Assertion-test generator (ATG)
| Method | Path | Description |
|---|---|---|
POST | /agent/run/{jobID} | Process an ATG job. Accepts optional ?timeout=<seconds> (default 30). |
POST | /agent/execute-request | Execute an HTTP request through the ATG runtime (used during assertion authoring). |
POST | /agent/service-url | Resolve a Service URL inside the cluster (used to target the app from the UI). |
POST | /agent/recordATGSandbox | Bind to an already-running ATG sandbox recording session. |
POST | /agent/stopATGSandboxRecord | Stop an ATG sandbox recording session. |
POST | /agent/replayATGSandbox | Start an ATG sandbox replay session. |
POST | /agent/stopATGSandboxReplay | Stop an ATG sandbox replay session. |
GET | /agent/ATGSandboxRecordStatus | Fetch ATG sandbox recording status. |
GET | /agent/ATGSandboxRecordLogs | Fetch ATG sandbox recording logs. |
GET | /agent/ATGSandboxReplayLogs | Fetch ATG sandbox replay logs. |
GET | /agent/autoReplayLogs | Fetch auto-replay logs. |
Proxy self-management
| Method | Path | Description |
|---|---|---|
POST | /proxy/update | Roll the proxy (and optionally the injected agent image) to a new version. See below. |
GET | /proxy/update/status | Current rollout state: "", updating, desired_applied, or reverted_by_gitops. |
POST | /proxy/shutdown | Gracefully terminate the proxy Pod (Kubernetes will reschedule it). |
GET | /logs/proxy?... | Tail proxy-pod logs. Same flags as session log endpoints. |
GET | /logs/proxy/download | Download proxy logs as ZIP (current + previous container, when available). |
GET | /autoreplay/debug-bundles | List captured auto-replay debug bundles. |
GET | /autoreplay/debug-bundles/{bundleID} | Fetch one auto-replay debug bundle metadata record. |
GET | /autoreplay/debug-bundles/{bundleID}/download | Download one auto-replay debug bundle. |
POST | /autoreplay/debug-bundles/{bundleID}/share | Share one auto-replay debug bundle through the configured API server. |
POST /proxy/update body:
{
  "proxy_image": "ghcr.io/keploy/k8s-proxy:v1.4.0",
  "agent_image": "ghcr.io/keploy/keploy:v3.7.1"
}
The proxy validates that you are bumping the same image repository (you cannot swap ghcr.io/keploy/k8s-proxy for an unknown registry) and then patches its own Deployment. If a GitOps controller (Argo CD, Flux) reverts the bump, /proxy/update/status reports reverted_by_gitops with guidance to update your Helm values or manifest repo instead.
Namespace scoping
When the proxy is installed with watchNamespace=<ns>, every API call is force-scoped to that namespace:
GET /deploymentsignores thenamespacequery and returns only that namespace.- Any request whose
namespacefield does not match returns403with{"error":"this proxy is scoped to namespace \"<ns>\""}.
Leave watchNamespace unset to run cluster-wide. Cluster-wide mode requires Deployment get/list/watch RBAC across all namespaces, which the default Helm chart provisions.
Related guides
- Static Deduplication—drop duplicate traffic at record time using the
static_dedupfield. - Remove Duplicate Tests—coverage-based dedup at replay time (
keploy dedup). - Public REST API—Keploy Cloud control plane (apps, suites, jobs).
- Kubernetes installation—install and configure the Kubernetes Proxy.
- GitOps with Argo CD—manage the proxy via GitOps, including how
/proxy/updateinteracts with reverts.