Record test cases
Keploy records live traffic on your deployment's pods. Each request your app receives becomes a test case, and each outgoing call your app makes, such as a database query or an HTTP call to another service, is saved as a mock.
Start a recording
Starting a recording restarts the pods you record, so that they come back up with capture attached. Start a recording when a restart is acceptable.
- In the sidebar, open Clusters and click your cluster.
- On the Deployments tab, click Record on the deployment you want to capture.
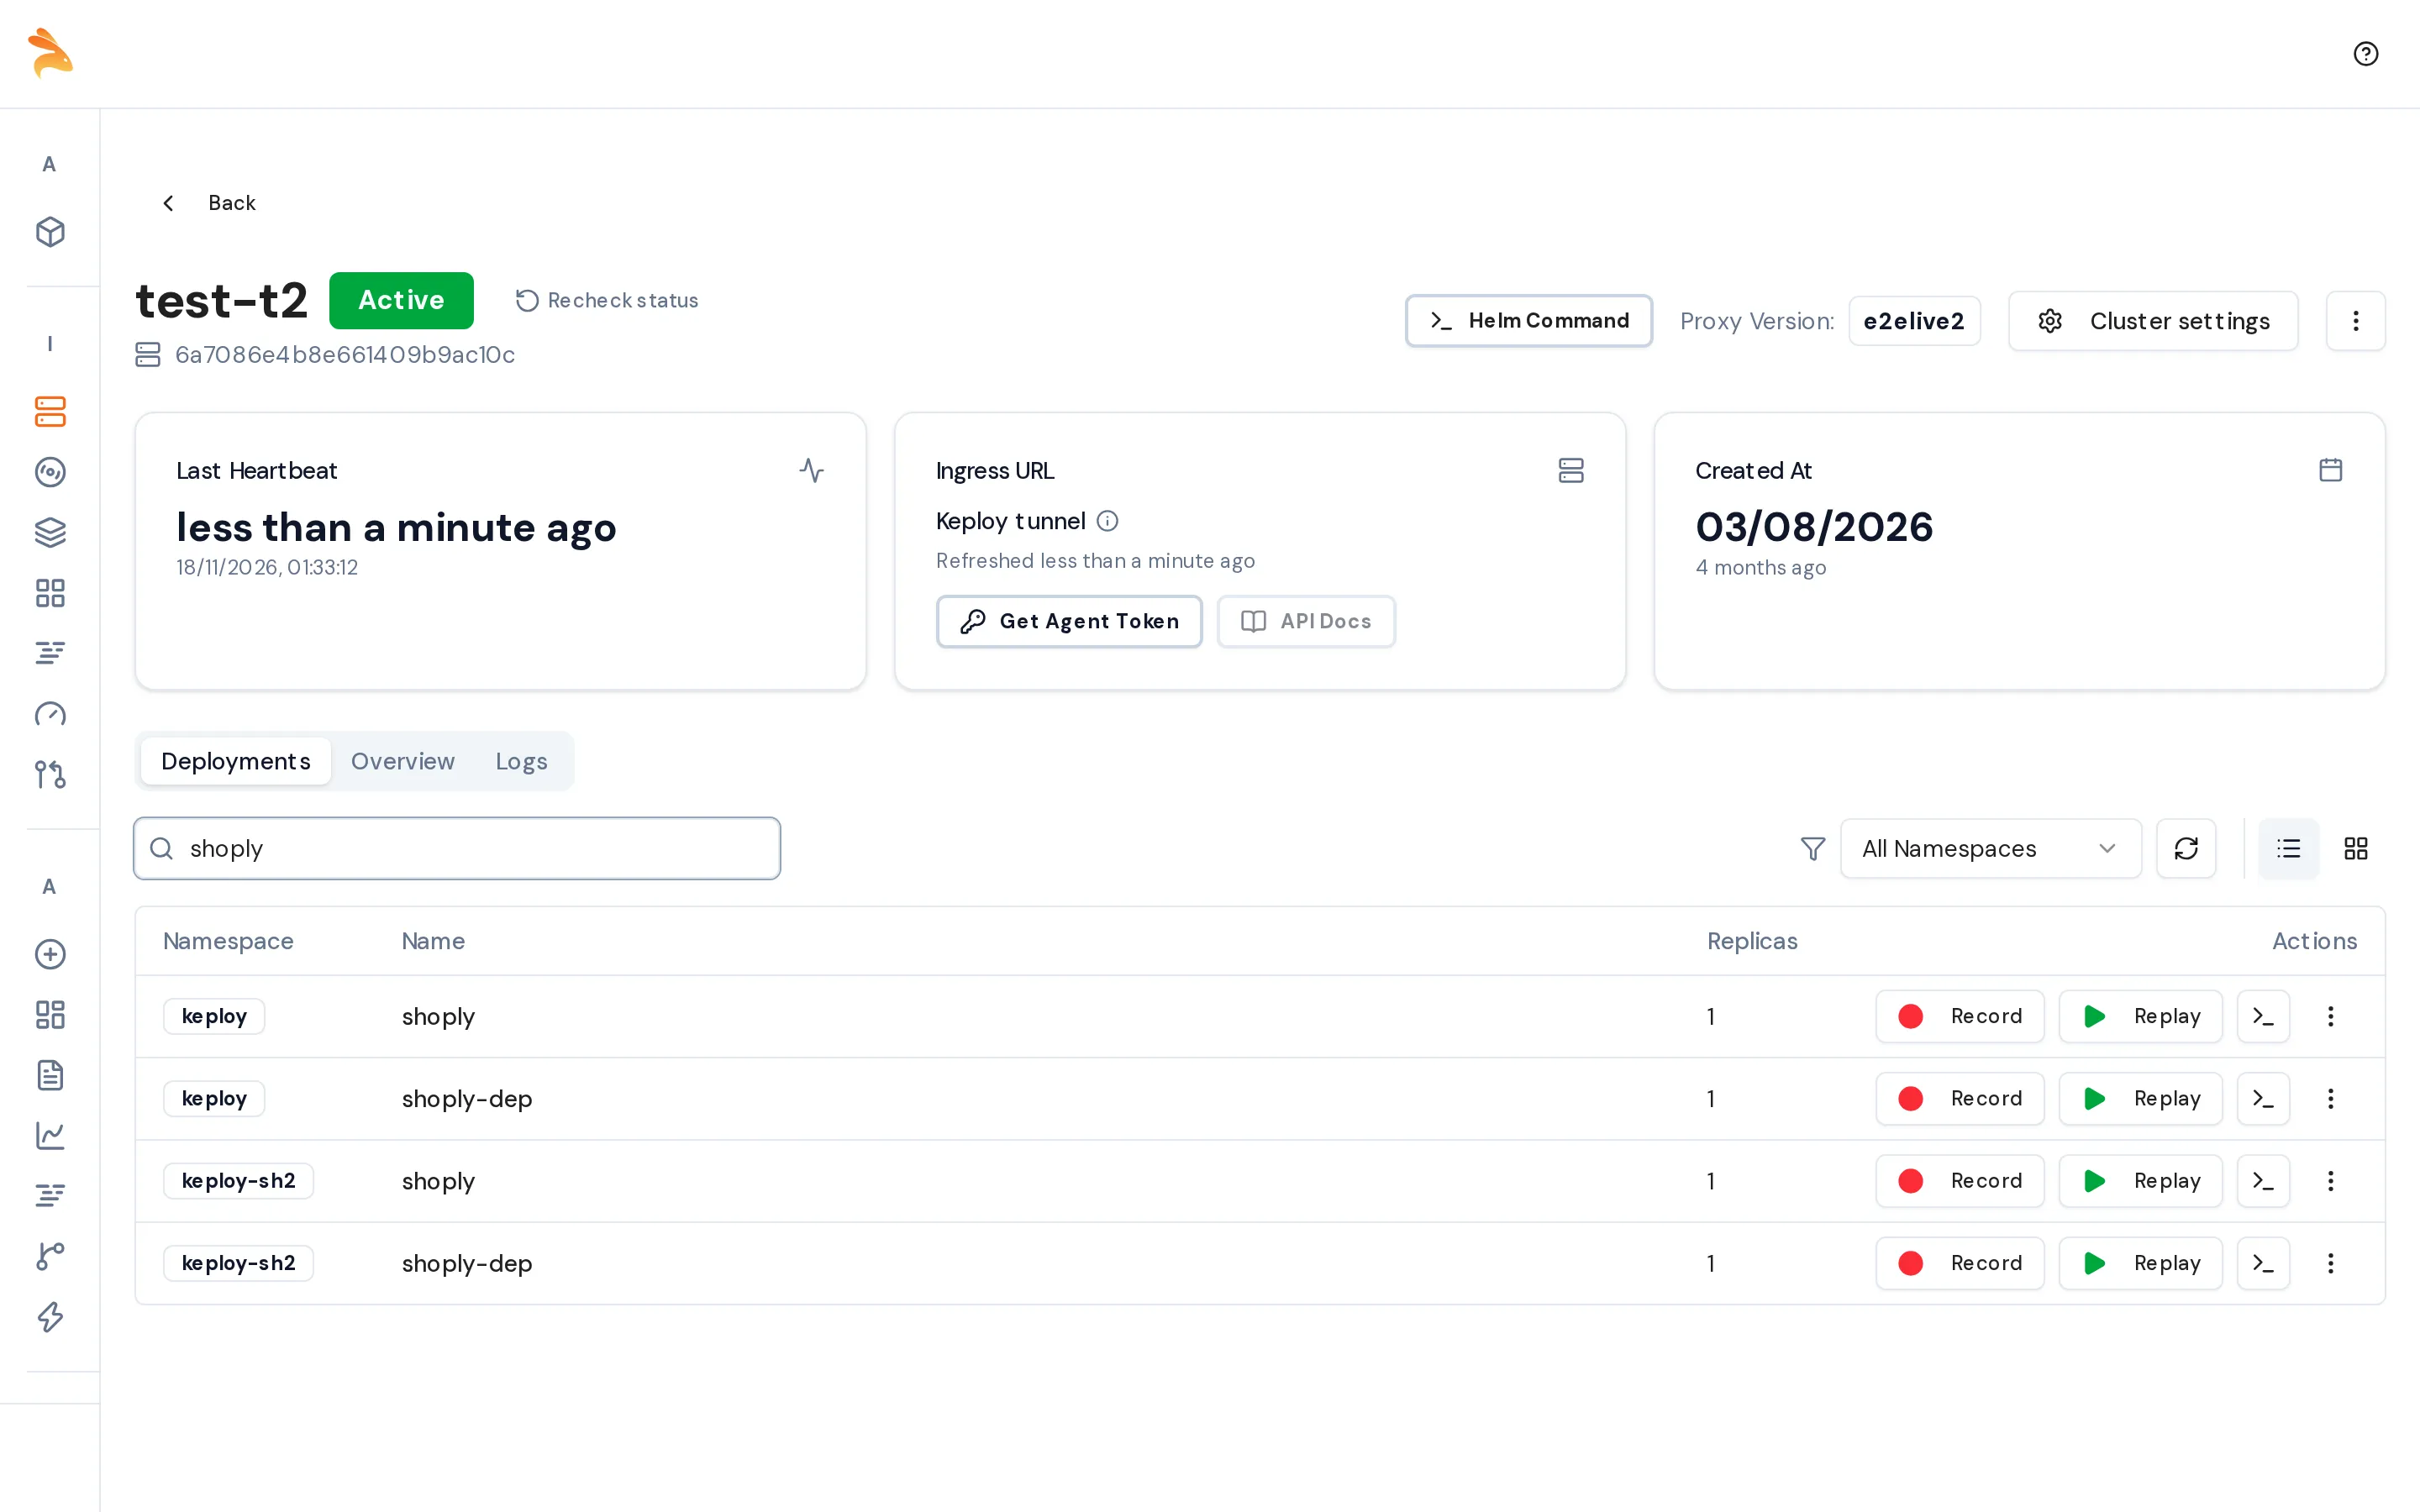
- Pods: choose the Number of pods to record and, optionally, Auto-stop after. Click Next.
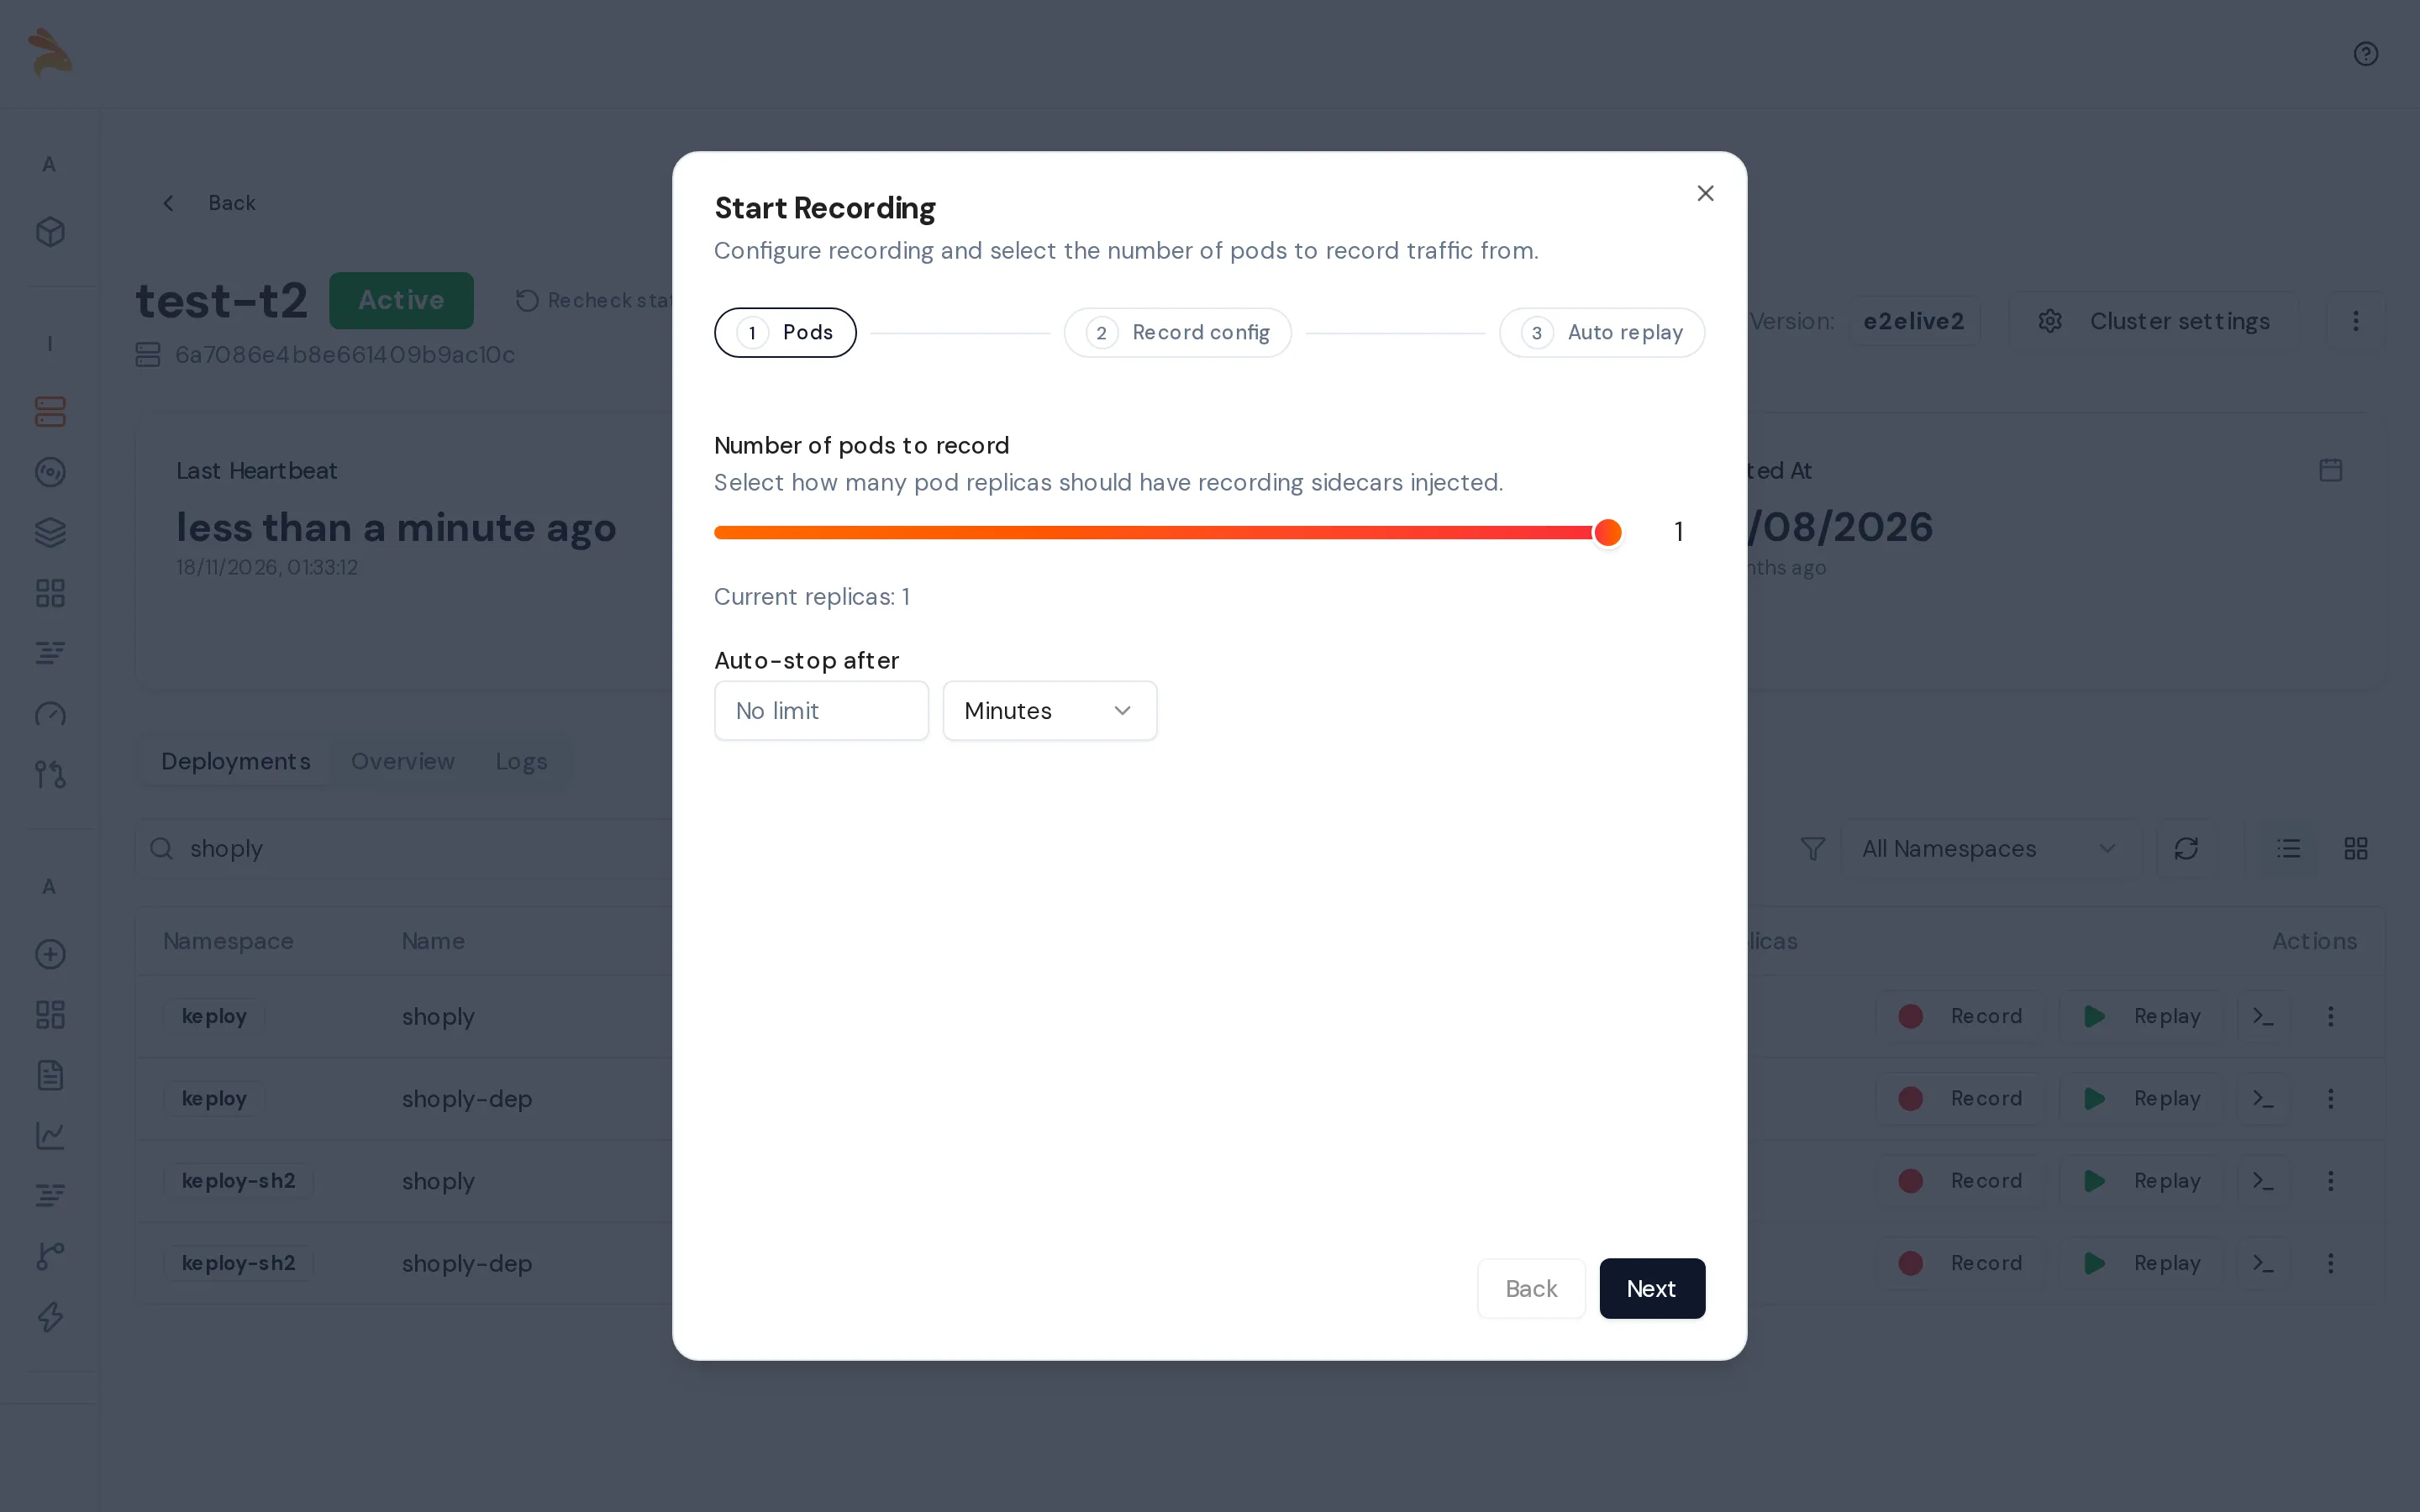
- Record config: add filters and choose how to deduplicate. Click Next.
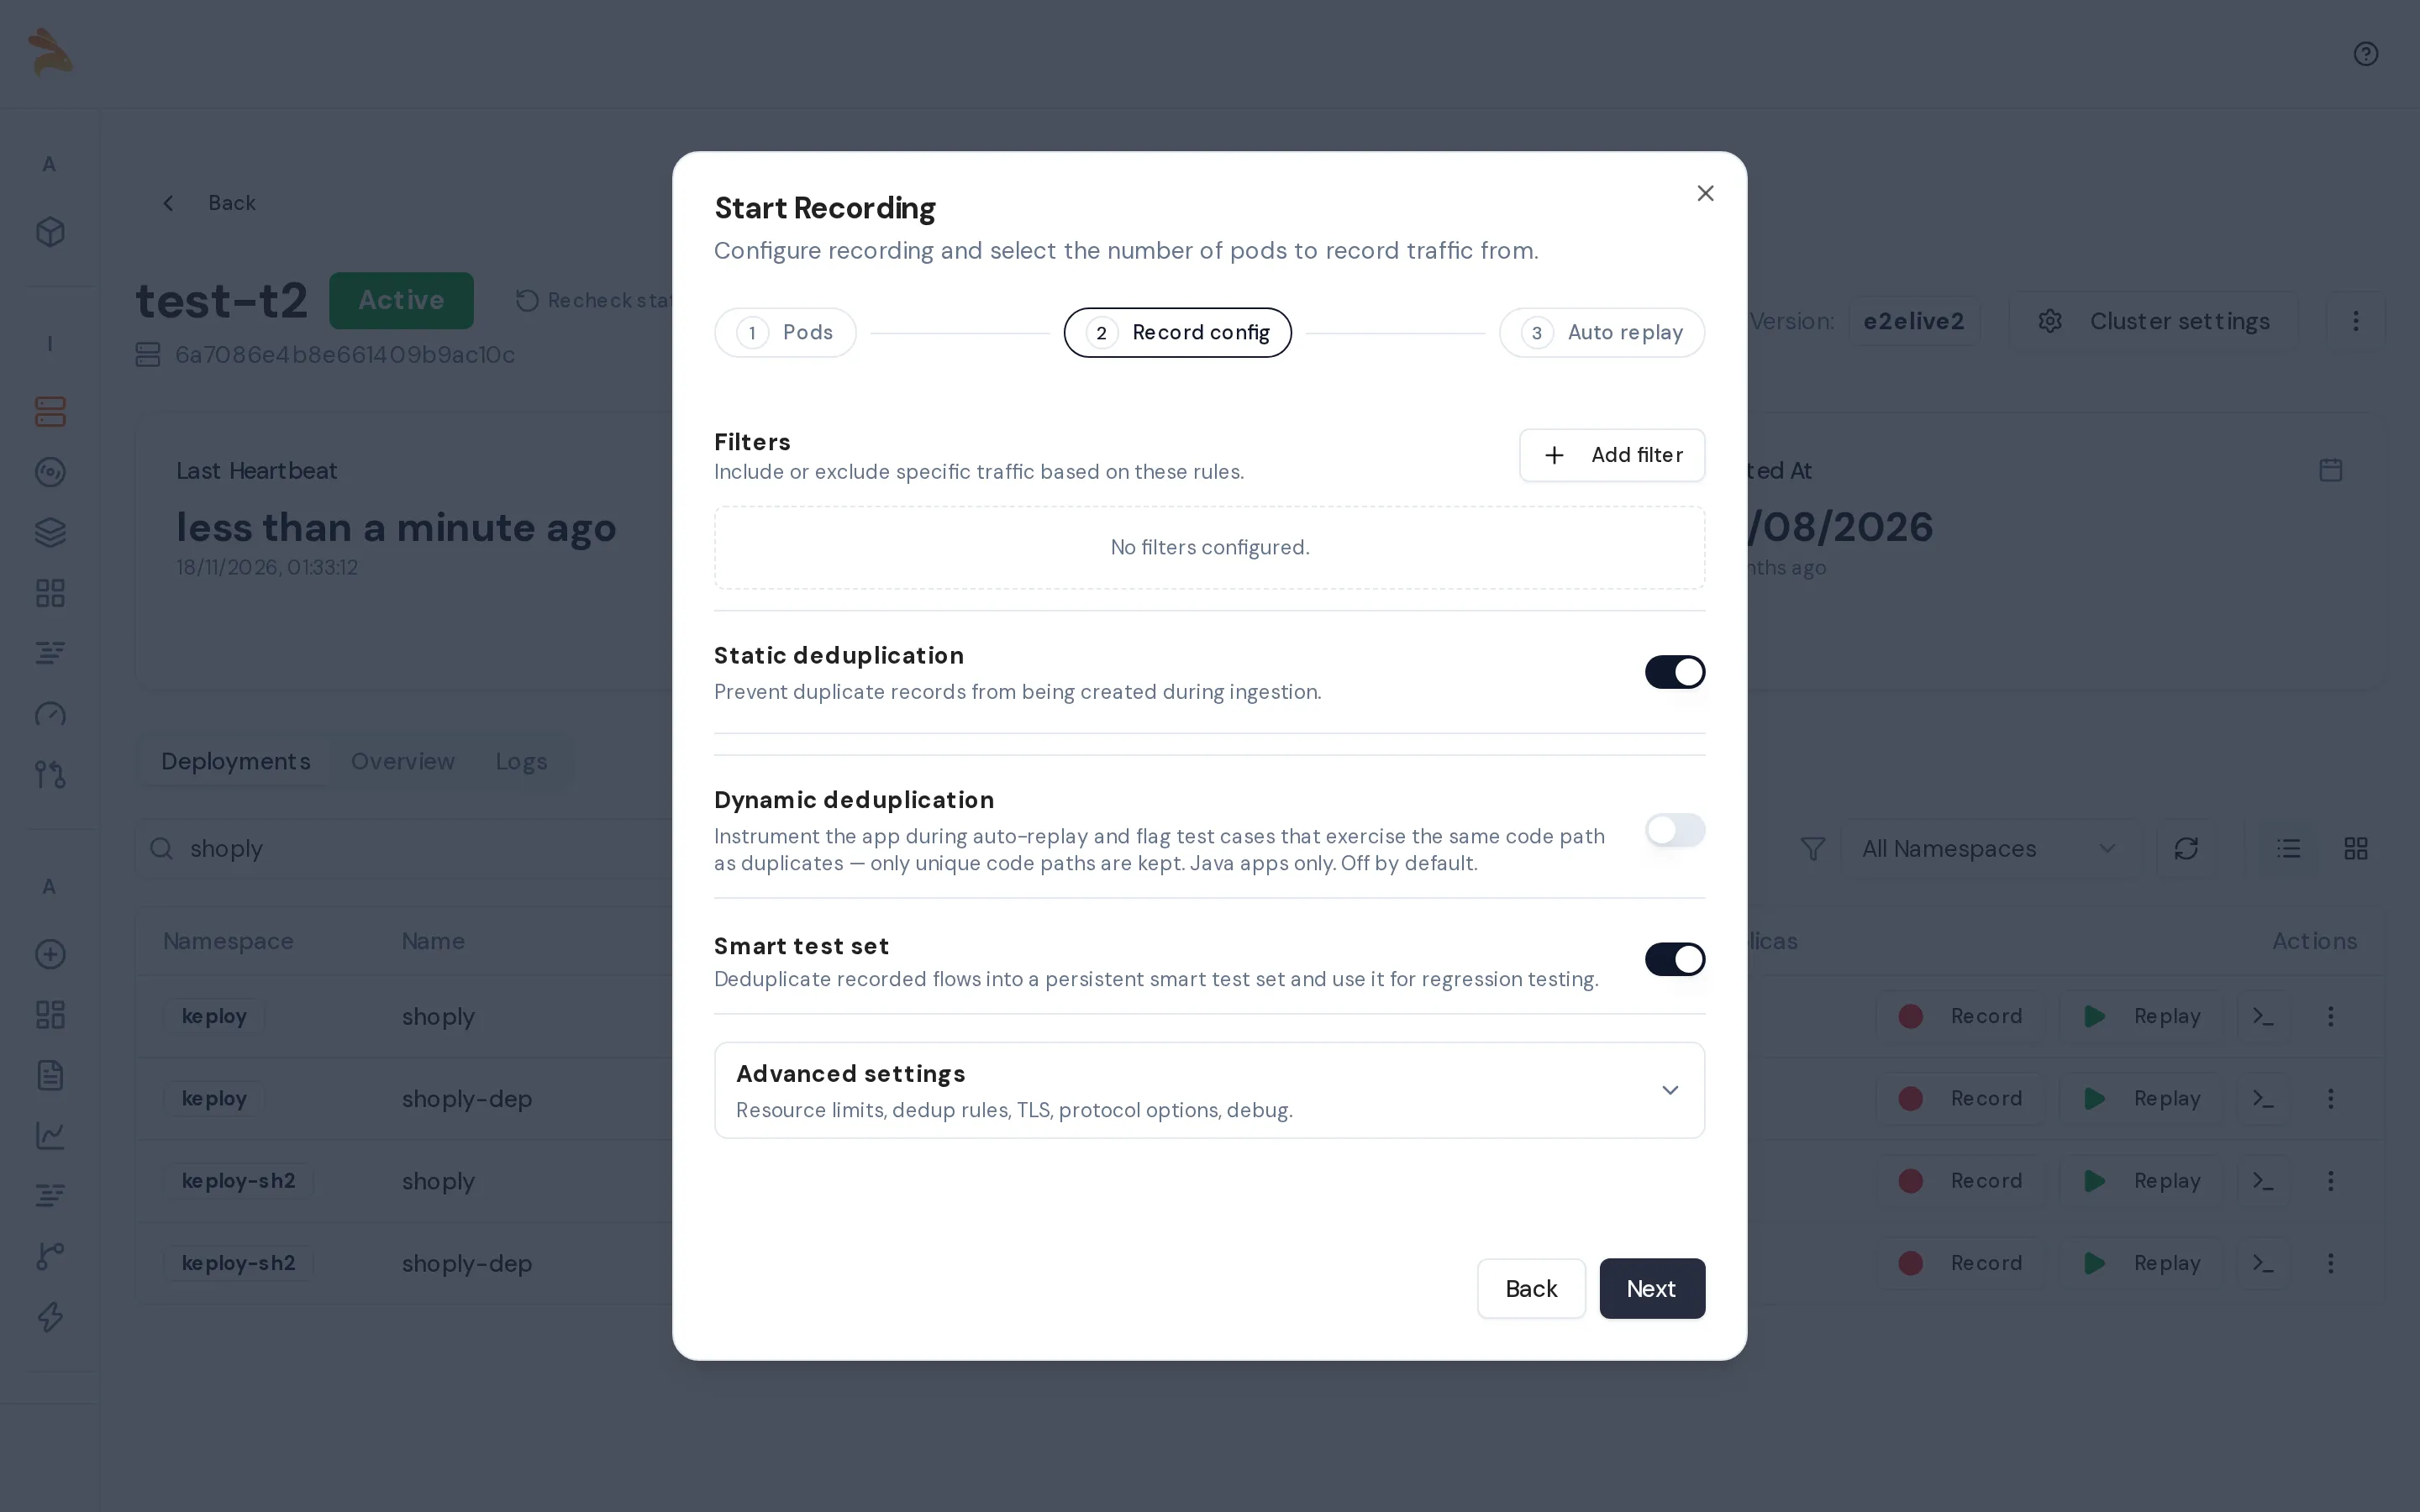
- Auto replay: set how often Keploy replays what it captures. For details, see Auto-replay. Click Start Recording.
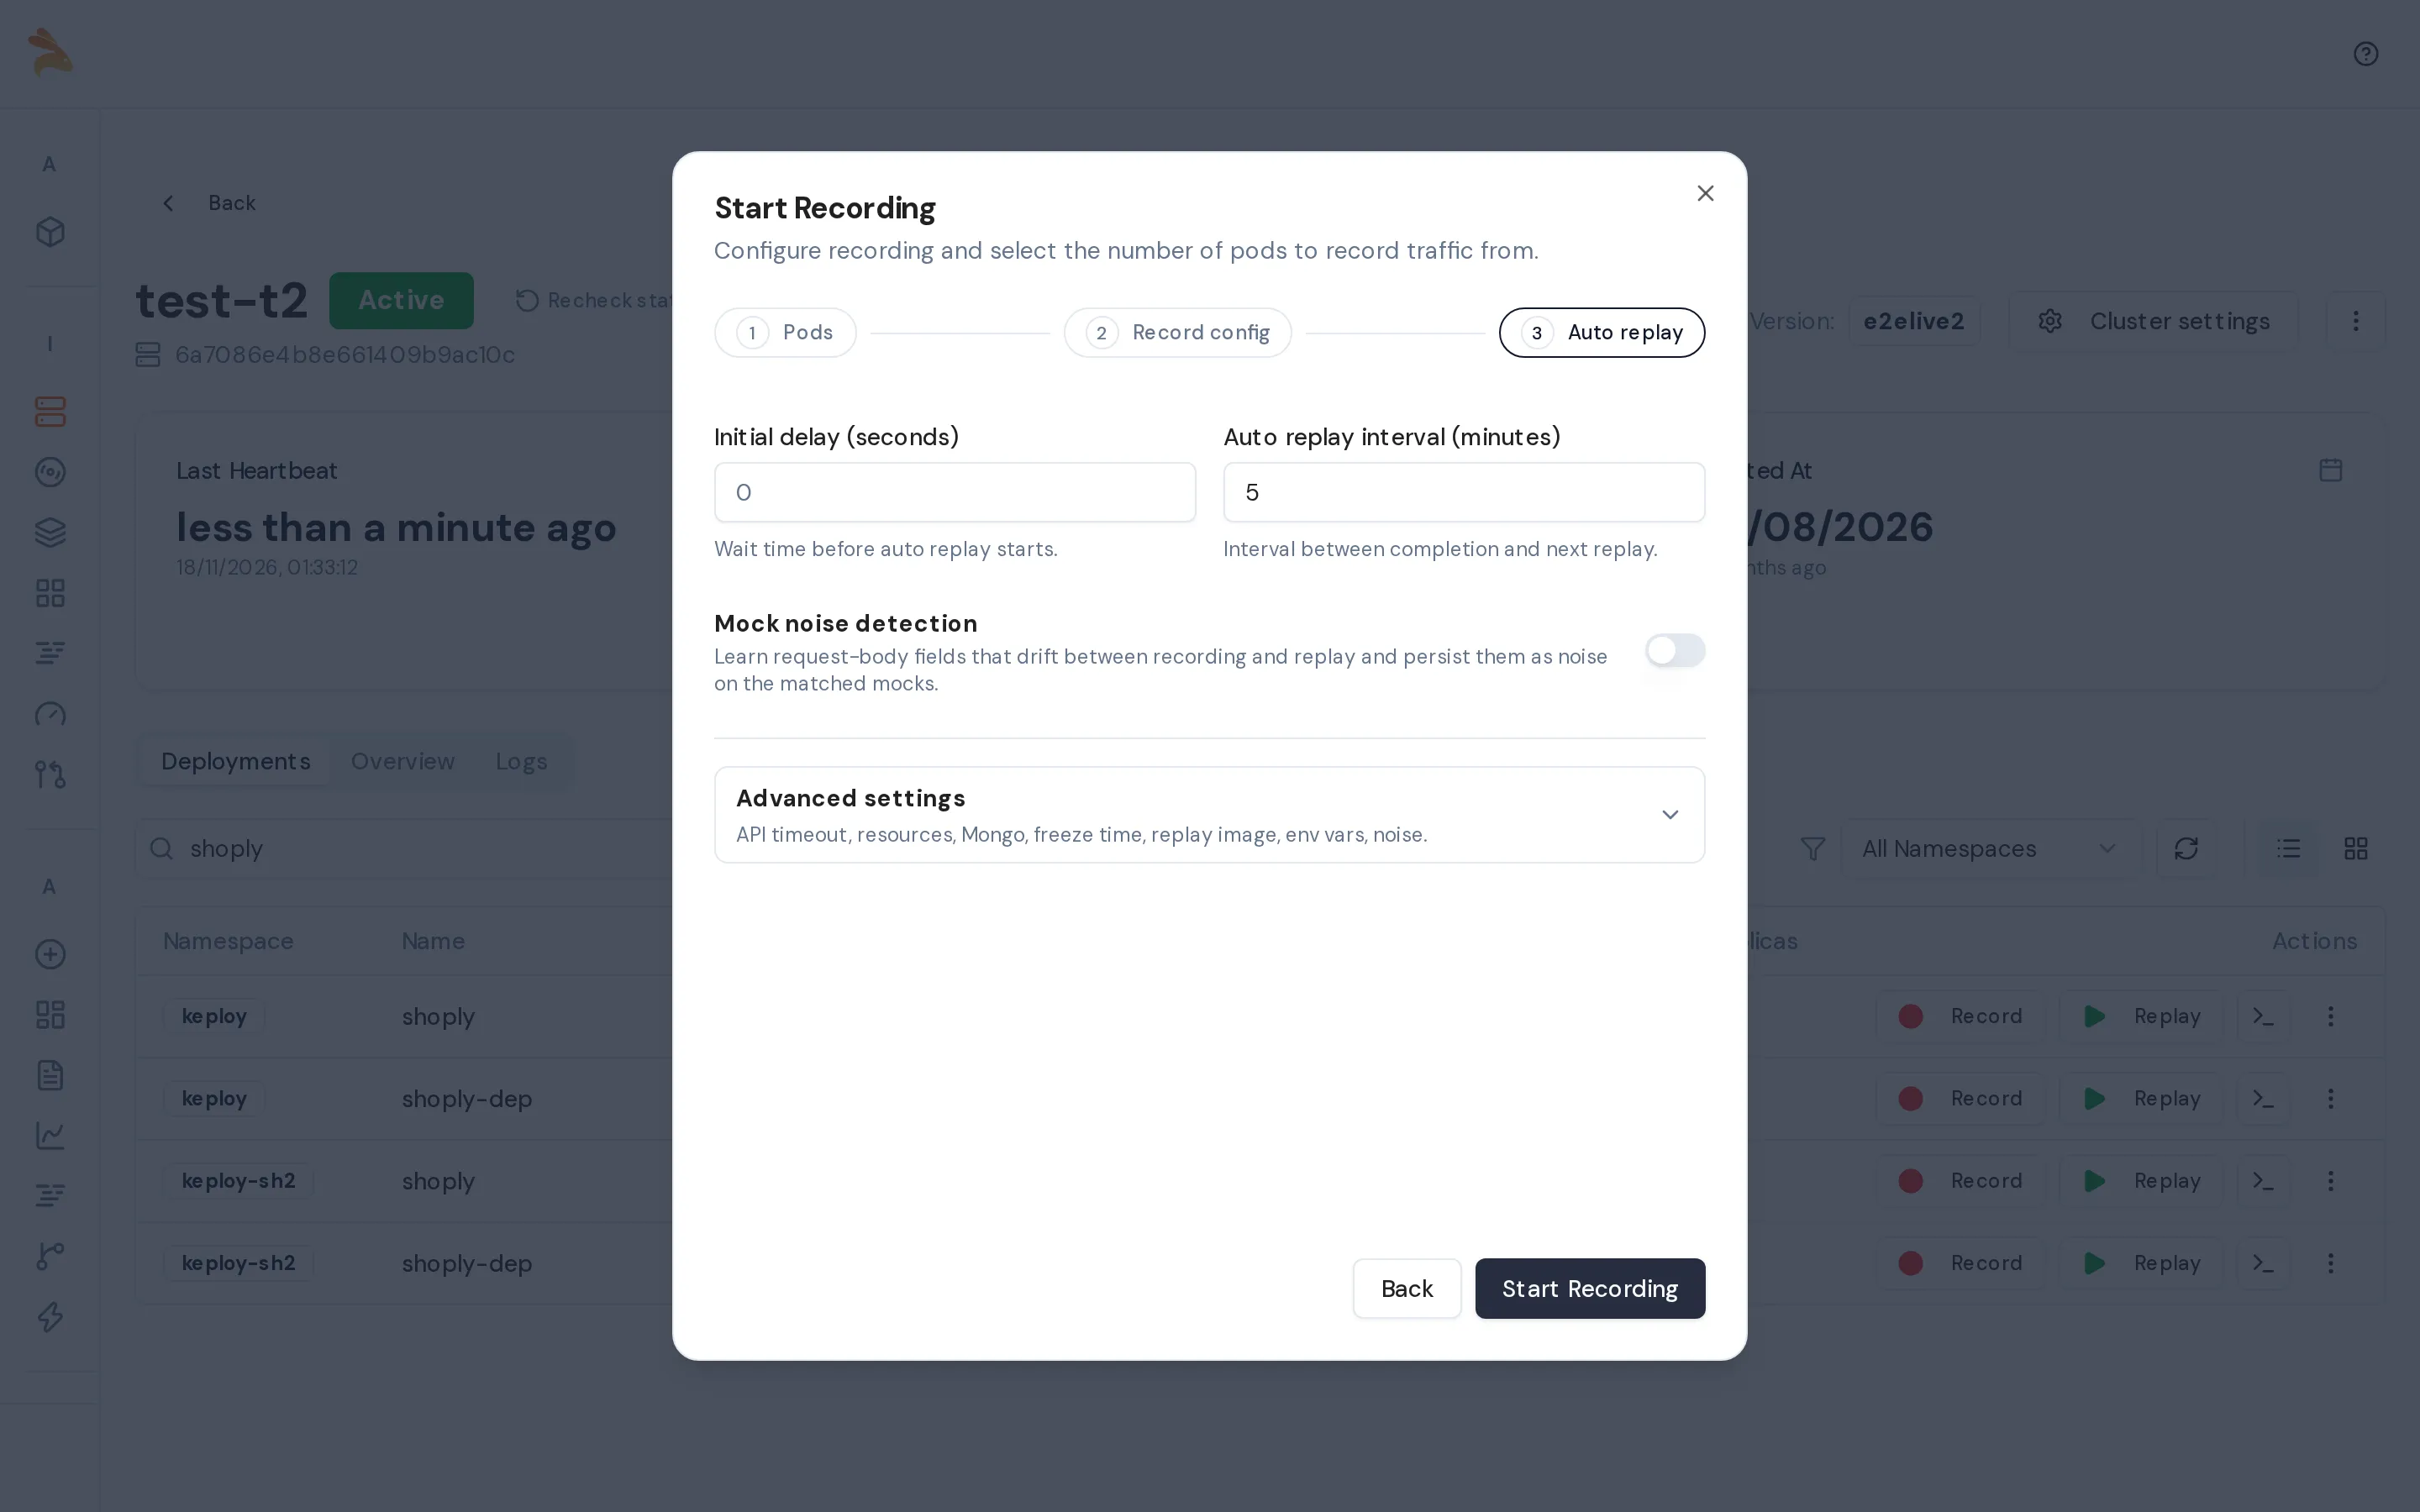
You can also open this dialog from the Recordings page with the Record button.
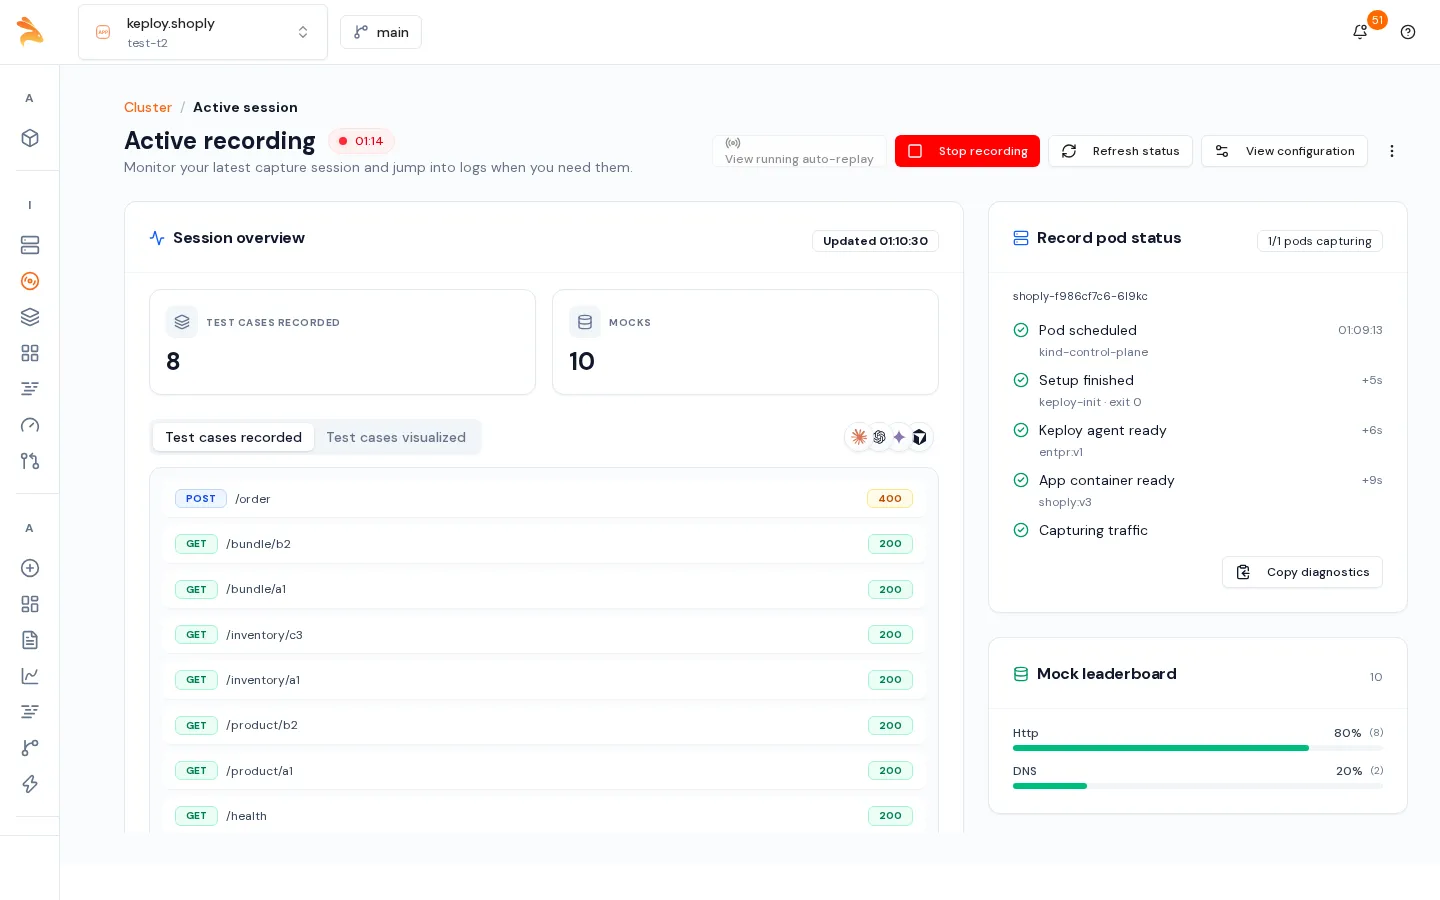
When the recording starts, the Active recording page opens. It shows the number of test cases and mocks captured so far, each request as it is recorded, and the status of the recorded pods.
Send traffic
Keploy records the requests that reach the recorded pods. Use your app as you normally would: run your test suite or a load script, use the frontend, or call the API at its usual URL. Cover the endpoints and edge cases you want tests for. With static deduplication on, which is the default, each distinct request shape becomes one test case.
If the app isn't reachable from your machine, for example because it has no external URL, open a tunnel to it.
With kubectl port-forward, forward a local port to a recorded pod. The Active recording page lists the recorded pods under Record pod status.
kubectl port-forward -n <namespace> pod/<recorded-pod> 8080:<container-port>
curl http://localhost:8080/<endpoint>
With an SSH tunnel, when only a jump host (bastion) can reach the app, forward a local port through the jump host. <app-address> is an address the jump host can reach, such as the app's internal load balancer, ingress or NodePort.
ssh -N -L 8080:<app-address>:<port> <user>@<jump-host>
curl http://localhost:8080/<endpoint>
A Service spreads requests across all of a deployment's pods. When you record fewer pods than the deployment runs, only the requests that reach a recorded pod are captured. kubectl port-forward svc/<service> connects to a single pod, which may not be a recorded one, so forward to pod/<recorded-pod> instead.
Recording options
The dialog remembers the values you used last time for each deployment. The defaults below apply to a deployment's first recording.
| Option | Step | Default | What it does |
|---|---|---|---|
| Number of pods to record | Pods | 1 | How many pods to capture, up to the HPA maximum or the replica count. |
| Record all pods | Pods | Off | Captures every pod. Shown only when the deployment has an HPA. |
| Auto-stop after | Pods | Empty | Stops the recording after this long. When empty, the cluster's maximum recording duration applies if your admin set one; otherwise the recording runs until you stop it. |
| Add filter | Record config | None | Includes or excludes requests by path, host, port, method or header. See Recording filters. |
| Static deduplication | Record config | On | Skips a request when one with the same method, path, header names, status and body structure was already captured. If you saved custom dedup fields on the Schema page, it stays on. See Static Deduplication. |
| Dynamic deduplication | Record config | Off | Java apps only. During auto-replay, keeps one test case per unique code path and flags the rest as duplicates. Can't be combined with static deduplication. Also enables code coverage. See Dynamic Deduplication. |
| Smart test set | Record config | On | Adds the recorded flows, deduplicated, to the app's smart test set, which is used for regression testing. Shown only when Enable Smart Tests is turned on for your organization in Settings. |
| Advanced settings | Record config | Collapsed | Agent memory and CPU, Low Latency Mode (sidecar clusters only), and the containers to capture. |
Whether a cluster records with a sidecar or with the DaemonSet is decided when you connect the cluster, not in this dialog. See Choose a capture mode.
Stop the recording
Click Stop recording on the Active recording page. Alternatively, on the deployment row, click the Recording status and then Stop Recording.
If anything was captured since the last auto-replay round, Keploy runs a final round after the recording stops. Stopping from the Active recording page takes you to that replay, or to the Recordings page when there is nothing to replay.
View what you recorded
- Open Recordings, with your app selected in the app selector in the header.
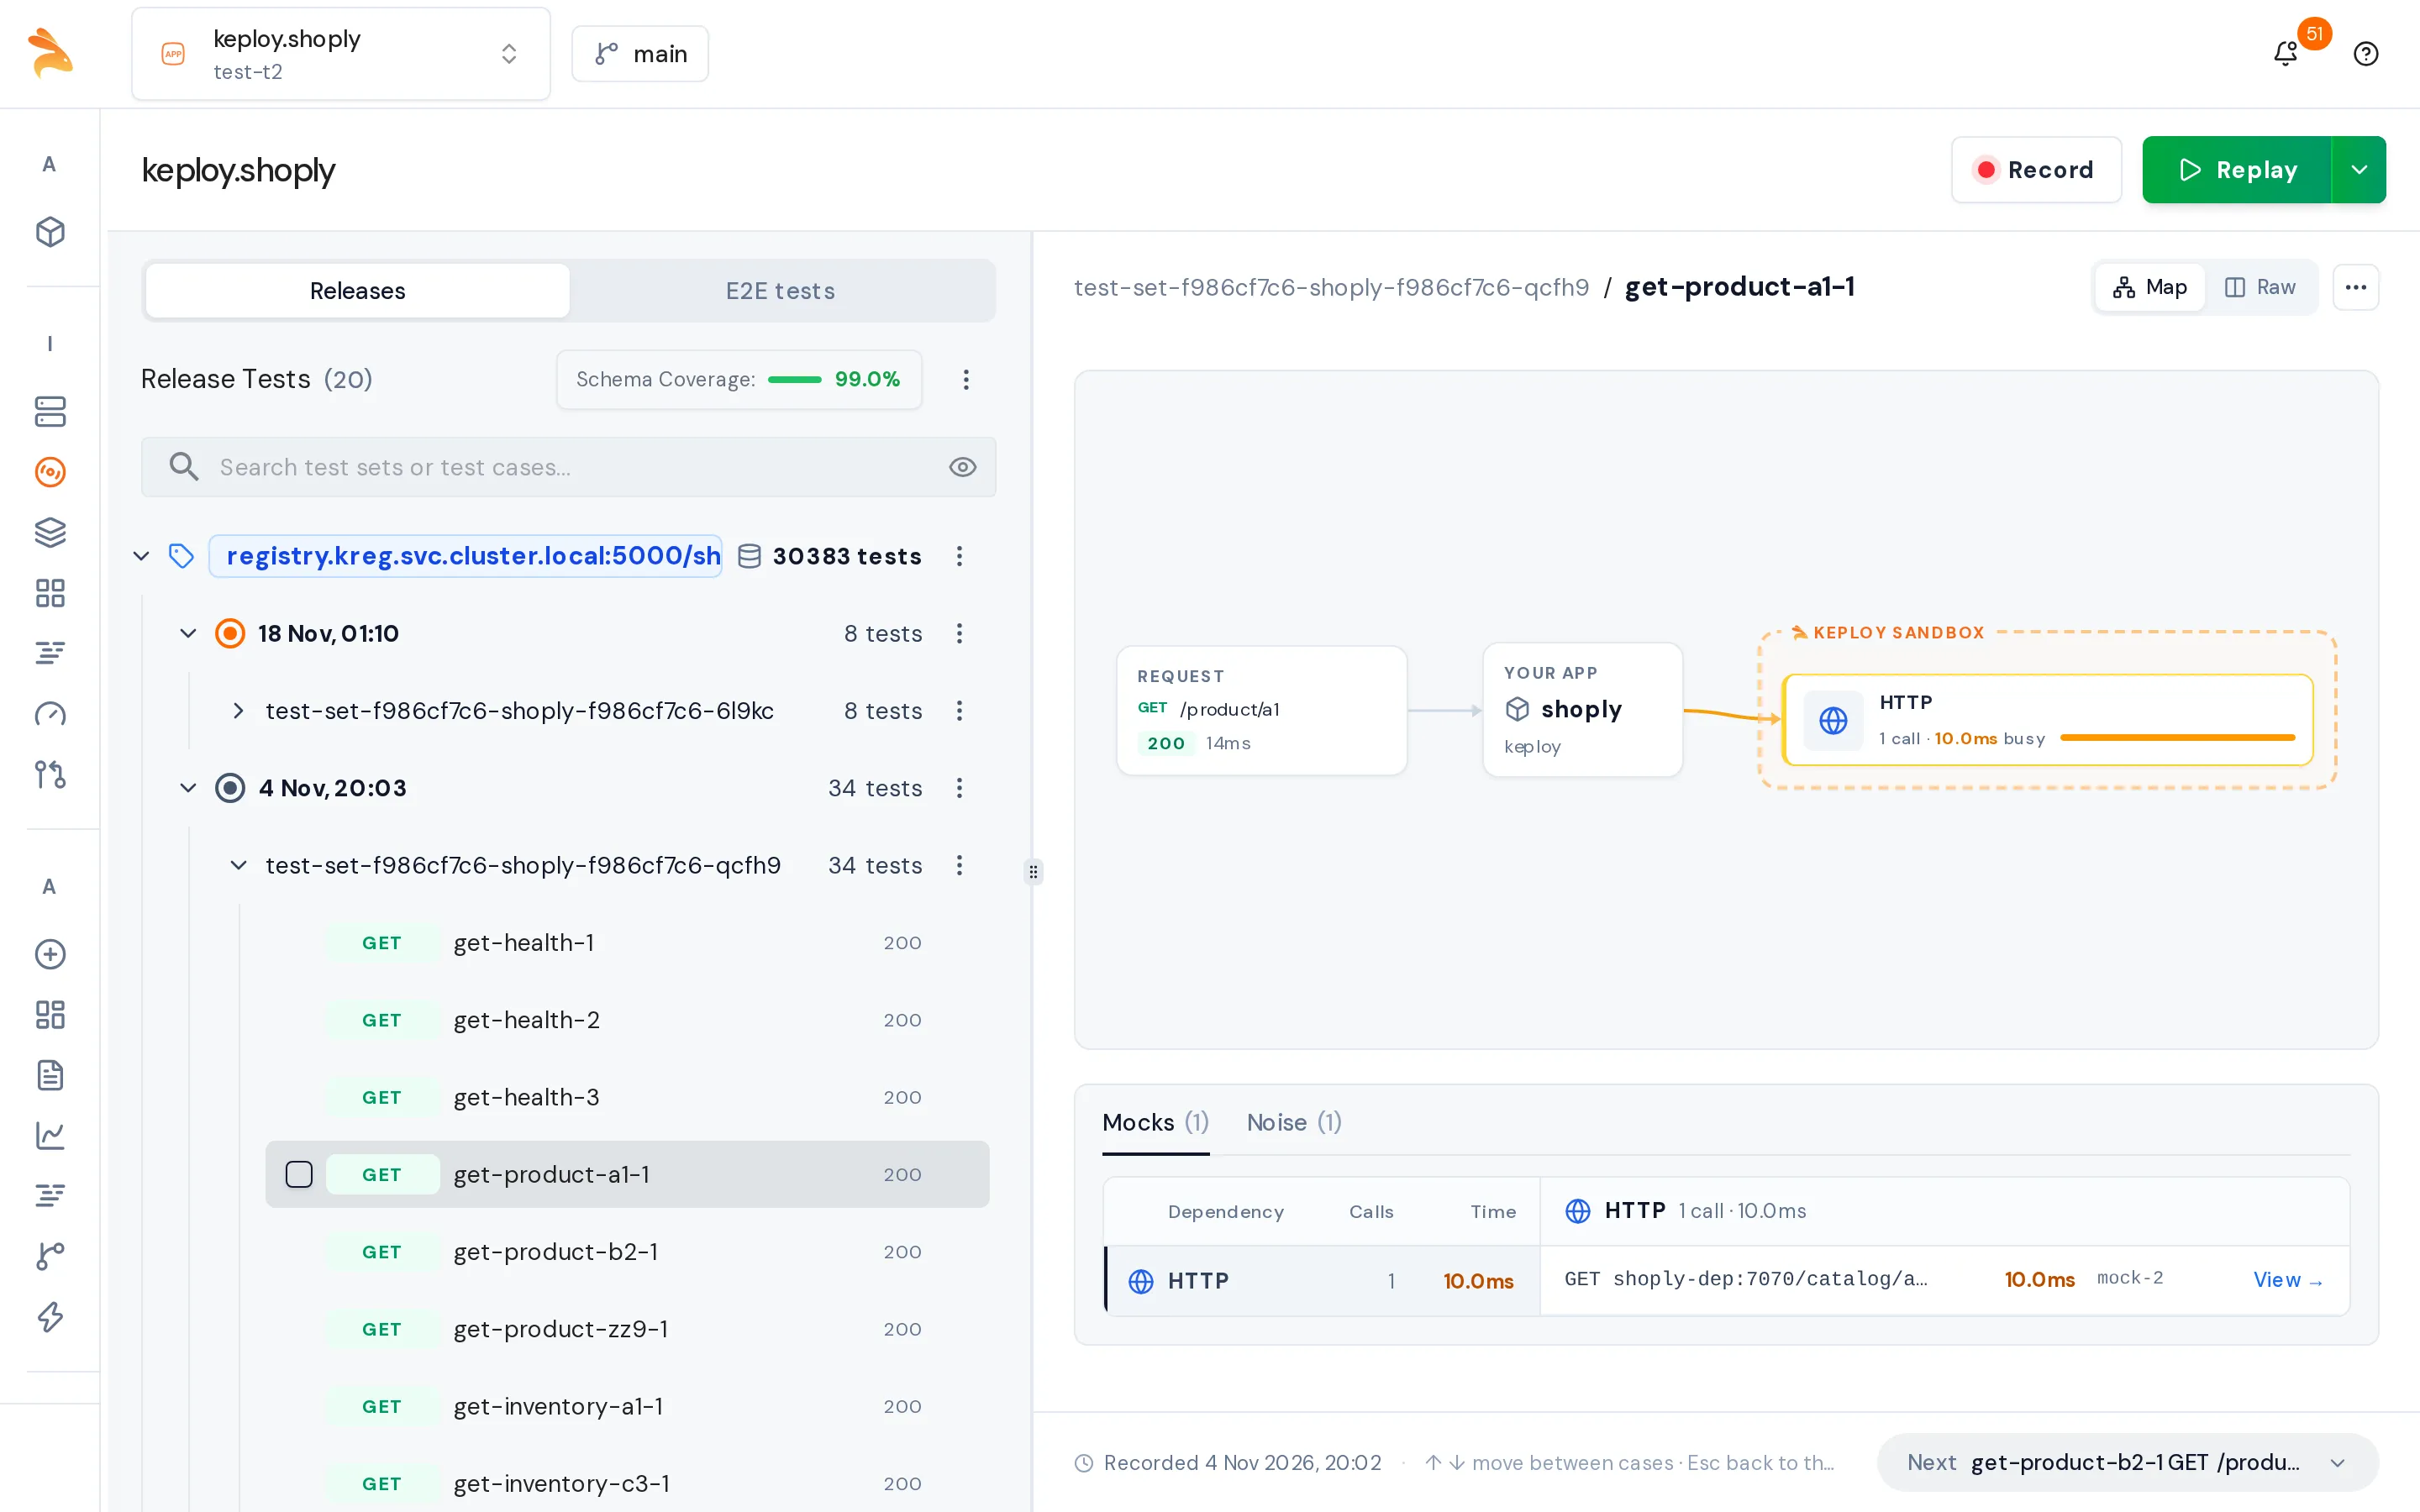
- In the left panel, expand a release and a test set, then click a test case.
- Review the test case:
- The Map view shows the request, your app, and each outgoing call that Keploy mocked.
- Raw shows the full request and response.
- The Mocks tab lists the outgoing calls, and the Noise tab lists the fields Keploy ignores.
If a test case has fields that change on every call, such as a timestamp, mark them as noise. To change a test case or its mocks, see Edit test cases and mocks.
Troubleshoot recording
| Message | What to do |
|---|---|
| You don't have permission to start recording on this cluster | Ask your admin for record permission on the cluster or the app. |
| A recording is already in progress for this deployment… | It was started from another tab, from the CLI or by a teammate. Stop it first. |
| Requested duration exceeds the cluster limit of … | Set Auto-stop after within the limit your admin set. |
| …has zero replicas; scale it up before starting recording | Scale the deployment to at least one replica. |
| Recording started, but no pods came up with the keploy sidecar within 60s… | Check the pod's events with kubectl describe pod. |
Related
- Set up: connect your cluster and install the CLI.
- Kubernetes Proxy REST API: start and stop recordings from a script.